
The $2.6+ Billion That Remains: NFIP Subsidization Five Years into Risk Rating 2.0
12 min read · Sep 9, 2026
Executive Summary
In October 2021, FEMA launched Risk Rating 2.0, the largest overhaul of National Flood Insurance Program (NFIP) pricing in the program’s 50-year history. It replaced decades-old, flood-zone-based rates with property-specific, full-risk pricing. The goal: charge every property what its flood risk actually costs and end the systematic underpricing that left taxpayers covering the program’s losses. New policies were repriced immediately; existing policyholders move toward full-risk under a statutory cap of 18% per year.
Five years into Risk Rating 2.0, the data shows the reform is working as designed. Over 50% of NFIP policies are now priced at their full-risk cost, up from one third in December 2022. What remains is no longer a broadbased pricing problem, but a measurable and increasingly concentrated tail.
Approximately 1.5 million policyholders, or 42% of the NFIP, still pay below their full-risk price, representing roughly $2.6 billion per year of remaining subsidy. Under the statutory cap limiting most annual premium increases to 18%, that gap will continue to decline and is on track to be largely eliminated by the late 2030s. Even so, an estimated $10–13 billion of additional subsidy will be provided before the transition is complete.
The remaining subsidy is highly concentrated:
- Properties valued at $1 million+ hold at least 17% of the subsidy while representing just 4% of policies.
- Second homes, rentals, and businesses hold 42% of subsidy dollars on only 28% of policies.
- The poorest fifth of census tracts receive the smallest share of subsidy dollars of any income quintile.
- Florida holds 48% of the national subsidy, approximately $1.2 billion per year.
This analysis provides key insights into the current and future state of NFIP pricing. As policymakers consider how this should evolve, the remaining subsidization should be understood for what it is: not an affordability program, but a legacy pricing discount ultimately borne by the U.S. taxpayer and allocated without regard to financial need. Because that discount is tied largely to policy tenure rather than ability to pay, a significant share flows to second homes, rental properties, businesses, and high-value homes. Future discussions about NFIP pricing should distinguish clearly between preserving these untargeted subsidies and providing deliberate, targeted assistance to primary homeowners for whom affordability of flood insurance is a genuine concern.
1. The Glidepath: A Primer
As of December 31, 2022, the Government Accountability Office (GAO) found the median NFIP policy cost $689 against a $1,288 full-risk price, an 87.0% gap (GAO-23-105977). More than three years on, this report updates that analysis.
Two mechanics drive everything in this report. Since October 2021, new NFIP policies are priced at the fullrisk rate, FEMA’s estimate of what the property’s flood risk actually costs to insure. Policies that predate October 2021 were not repriced overnight: federal law caps most annual increases at 18%, so existing policyholders ride a “glidepath,” rising up to 18% per year until price meets full risk. The gap between the two, summed across the book, is the subsidy.
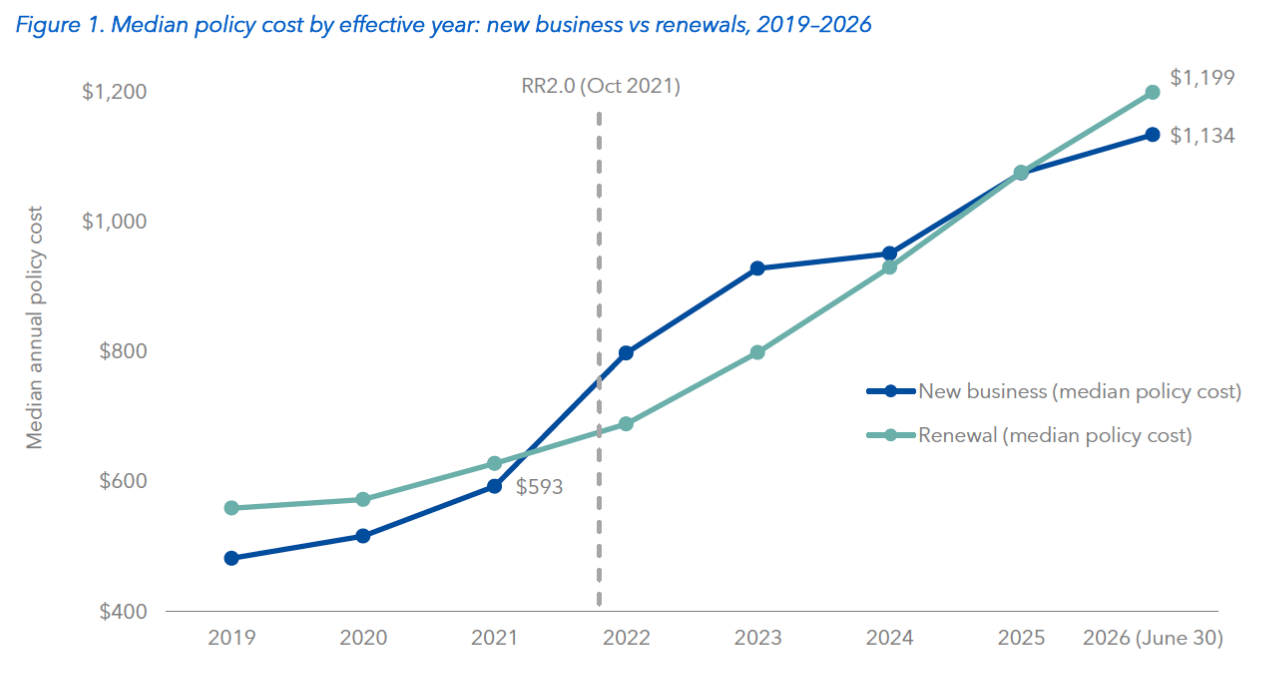
The entry-price effect was immediate. Median new-business cost rose from $593 in 2021 to $1,134 in 2026 through June 30, up 91.2%, and new-business volume fell 19.2% (407,235 contracts in 2021 to 328,862 in 2025). Figure 1 shows the transition’s oddest feature: in 2022-23, new customers paying full risk cost more than capped legacy renewals ($798 vs. $689 at the 2022 medians). For roughly three years, the program charged its newest customers the most. The tiers converged by 2025.
Risk Rating 2.0 redistributed prices as well as raising them. Coastal V-zone new business fell 27.1% at the median, while the largest increases hit inland and Gulf states with cheap legacy rates (Alabama +90.2%, Mississippi +87.2%, Louisiana +77.7%).
The renewal book has converged steadily: the median full-risk-to-charged ratio fell from 1.83 in January 2022 to 1.0005 on June 30, 2026, and the at-full-risk share rose from 20.5% to roughly 56%. The median surviving policy is now at full risk. The remaining subsidy is a tail, not the middle of the book.
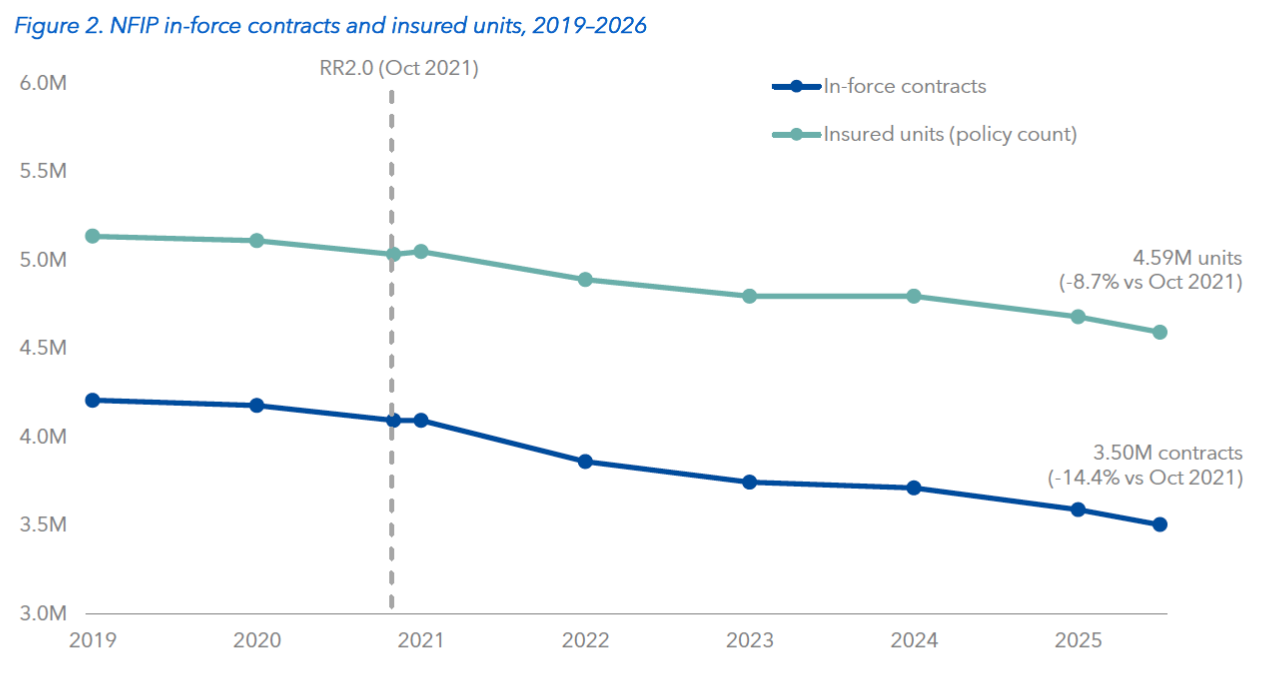
Convergence had a cost in coverage. Figure 2 shows in-force contracts fell 14.4% since October 2021 (4.1mm to 3.5mm), and insured units fell 8.7%, roughly one in nine insured buildings. The decline runs at about 120k contracts per year. One confounder: the NFIP’s authorization lapsed from October 1 to November 12, 2025, halting all new sales, so the late-2025 drop in new business (down 56.2% year-over-year in November) reflects the 43-day halt, not solely pricing impacts. Florida is the outlier, with contracts down just 1.1% and units up 3.5% post-Ian; its share of the US book rose from 28.0% to 32.3%. The program is concentrating in its deepest subsidy state.
2. The Book Today: Two Programs in One
Of 3.5mm in-force contracts, 1.5mm (44%) pay more than $10 per year below their full-risk cost; the other 56% pay full risk. Among subsidized policies the mean gap is $1,731 per year and the median roughly $766, with a long right tail (the 99th percentile is about $10,805).
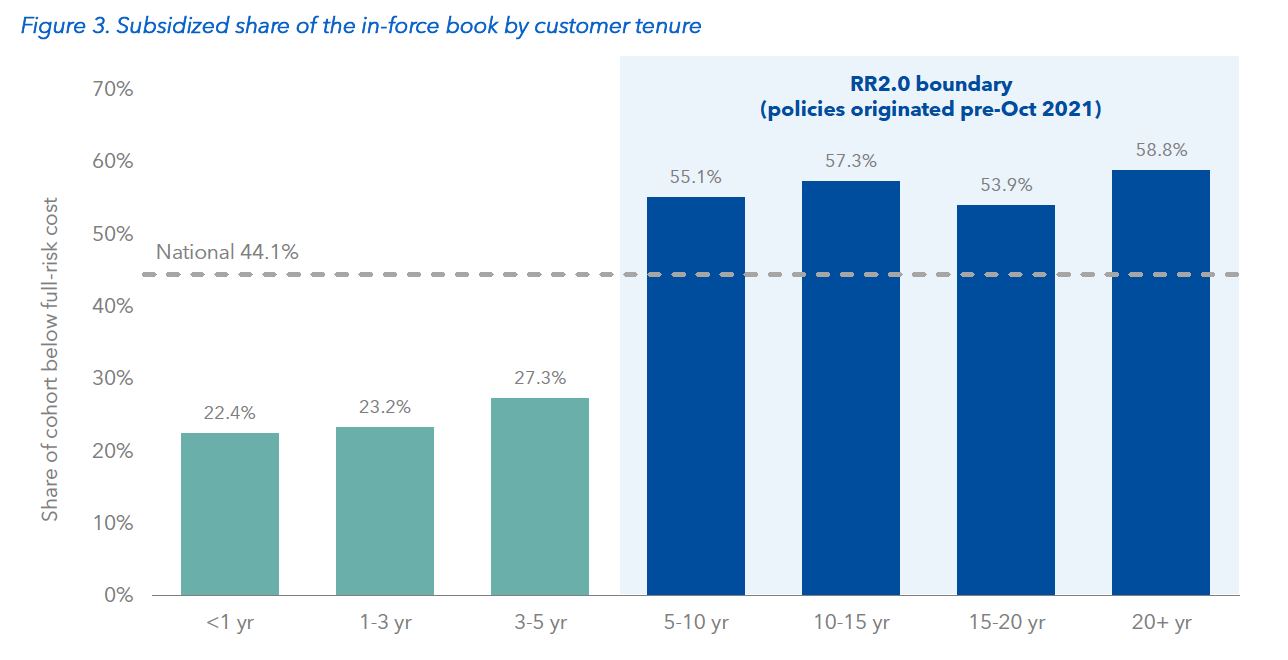
Tenure is the cleanest predictor. Figure 3 shows the subsidized share is 22-27% for customers under five years of tenure, then jumps to 54-59% above five years, a step sitting exactly at the Risk Rating 2.0 boundary. Subsidization of new business policies today is possible through the policy assumption process – meaning an existing, subsidized policy can be transferred to the new owner of a property and remain on its current glidepath.
Customers with five-plus years are 62% of the book but hold more than 83% of subsidy dollars ($2.2bn).
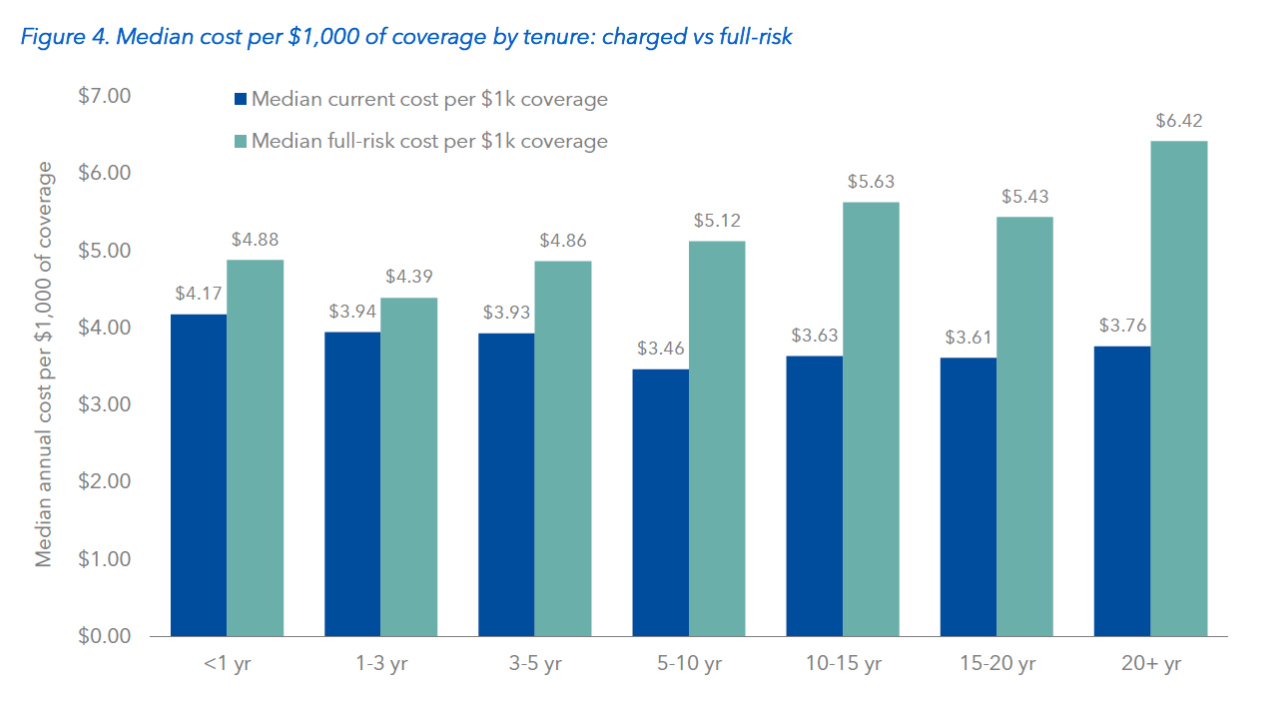
Figure 4 shows the resulting inversion. Per $1,000 of coverage, the median new customer pays $4.17 while the median twenty-plus-year customer pays $3.76, roughly 10% less, even though the tenured cohort’s fullrisk rate is far higher ($6.42 vs. $4.88). Long-tenured customers hold costlier-to-insure properties at lower unit prices. Under the glidepath, price reflects when you joined, not just your risk.
The discount also persists in time. The median twenty-plus-year subsidized customer is 3.3 years from full risk (a 1.7x price rise), and one in three needs more than five years.
3. Where the Subsidy Lives
Geography: a Florida story, hyper-local to two counties
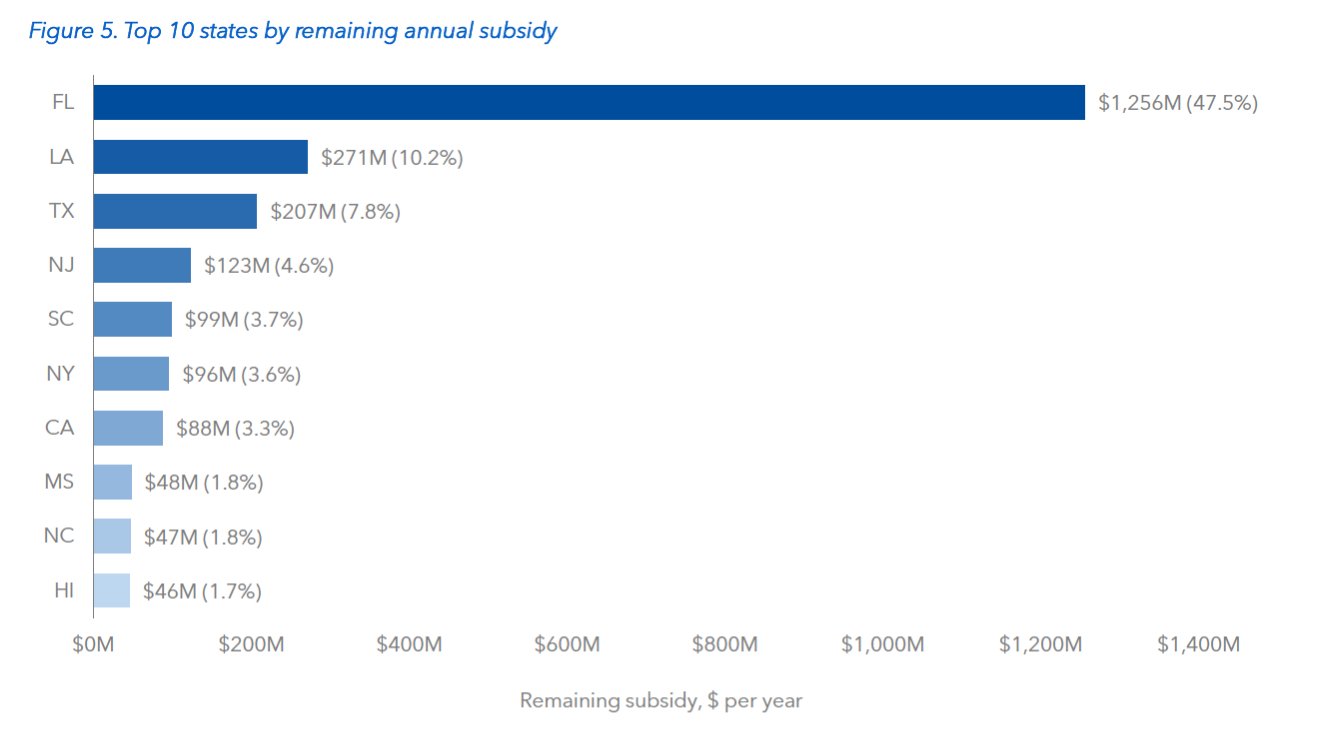
Florida holds $1.25bn per year, 47.5% of the US total, across 507.7k subsidized policies at a mean gap of $2,474 (43.0% above the national mean). Figure 5 shows the top five states (Florida, Louisiana $270.8mm, Texas $206.8mm, New Jersey $123.2mm, South Carolina $98.9mm) hold 73.8% of the total; the top ten hold 86.0%.
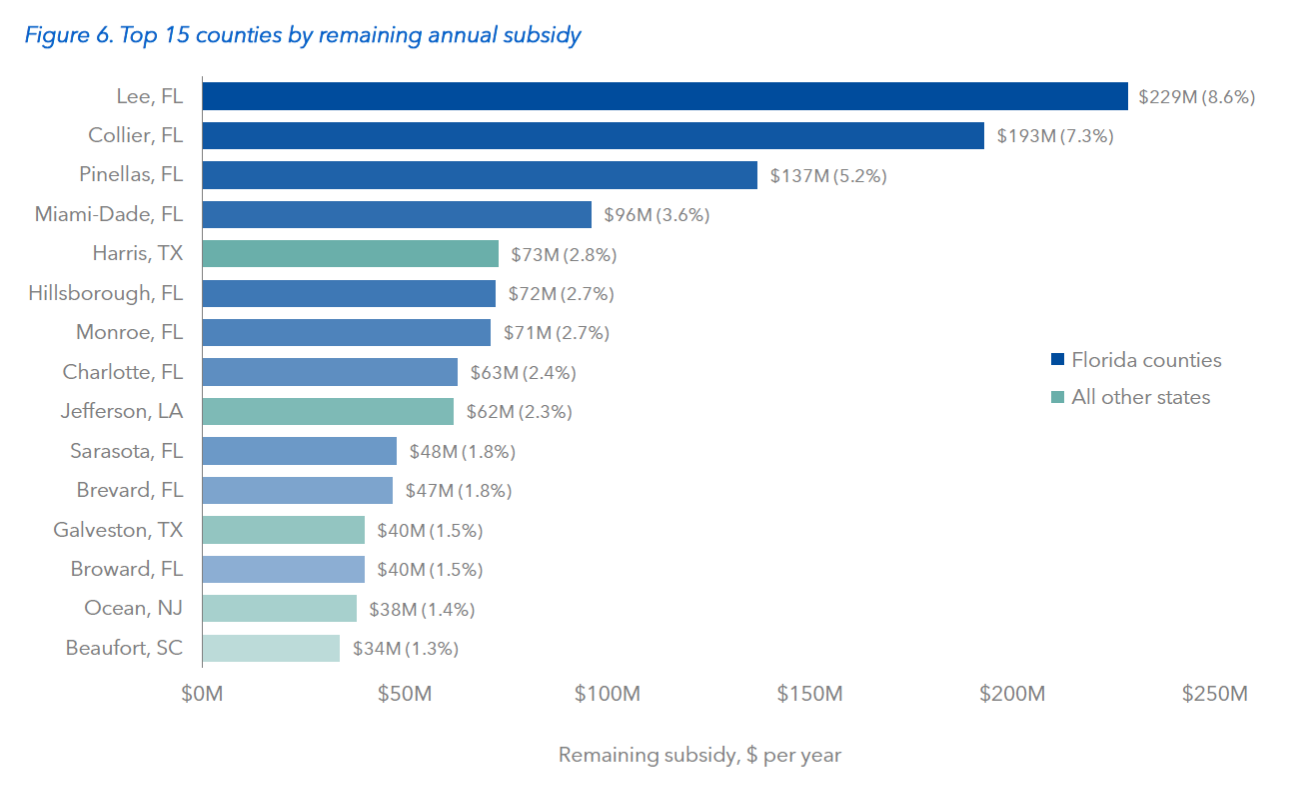
The concentration is hyper-local. Figure 6 shows the top 25 counties hold 57.3% of the national subsidy, and 13 of them are in Florida. Lee County alone holds $228.7mm (8.6%); Lee plus Collier, ground zero of Hurricane Ian in 2022, hold $422.0mm, 15.9% of the national total. In Collier, 76.8% of policies are subsidized at a mean gap of $4,457.
By share of book rather than dollars, the deepest states are inland and Gulf: West Virginia leads the nation at 67.0%, and West Virginia, Missouri, Kentucky, and Colorado all carry discounts at or above the national figure, because Risk Rating 2.0 repriced inland riverine risk hardest against legacy rates. The six highest subsidizedshare counties in the country (at least 1k policies) are all Louisiana bayou parishes, led by Plaquemines at 88.0%. The coastal-equals-subsidized intuition fails at county grain, though: Maryland’s Chesapeake book is just 19.6% subsidized, and Harris County, Texas has the largest subsidized count (114.3k) at the shallowest mean gap in the top 25 ($639).
Flood zones: an AE-zone problem at a nearly flat discount
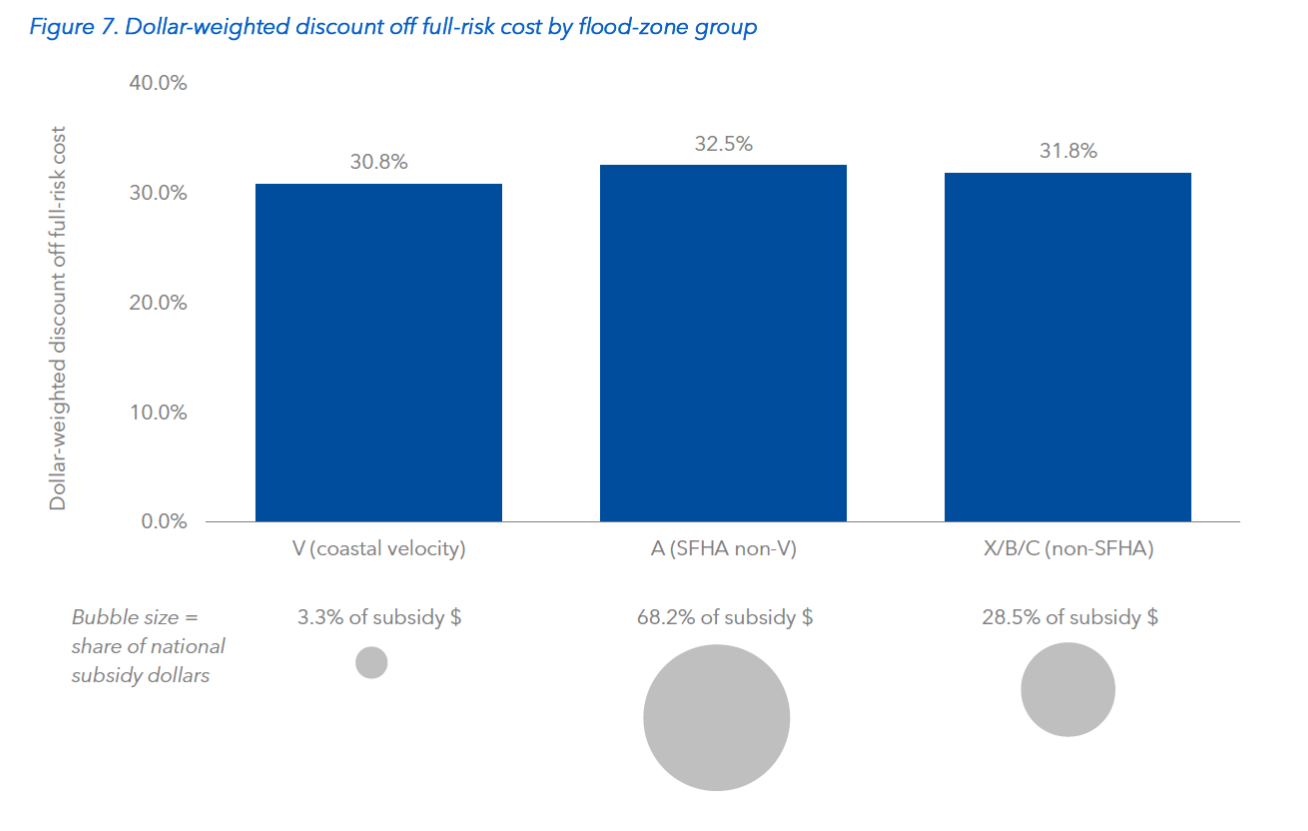
Figure 7 shows Special Flood Hazard Area (SFHA) zones hold 71.5% of subsidy dollars ($1.9bn), and zone AE alone holds 61.7%. To first order the subsidy is an AE-zone problem. But the dollar-weighted discount is nearly identical across hazard tiers (V 30.8%, A 32.5%, X/B/C 31.8%): every tier pays roughly 31% below cost in aggregate, and the dollar differences come from premium size.
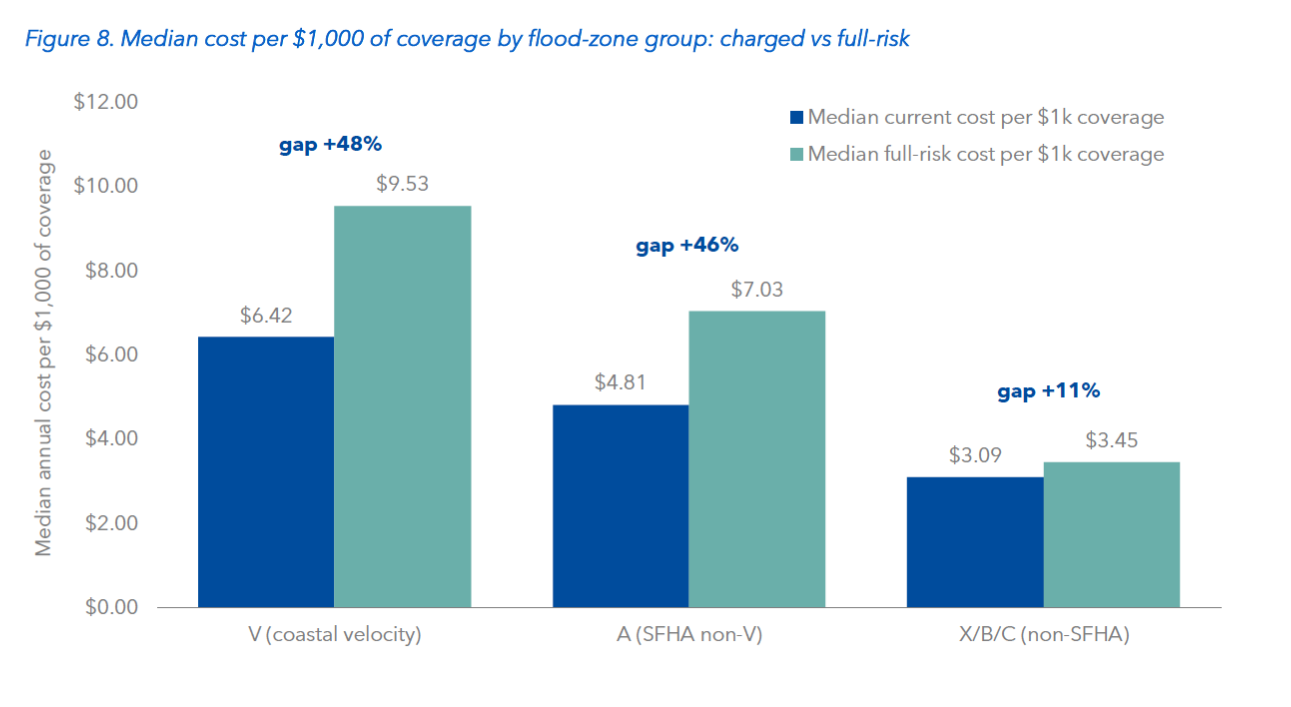
As shown in Figure 8, at the median, per $1,000 of coverage, V zones pay $6.42 against a $9.53 full-risk rate and A zones $4.81 against $7.03, gaps of roughly 46-48%, while non-SFHA buyers pay $3.09 against $3.45, roughly 11%. The voluntary buyer is near the actuarial price; the wedge lives inside the mandatory-purchase SFHA. Per policy, the mean subsidized V-zone gap is $3,781 versus $1,269 in X/B/C, and legacy-map zones B and C are the most-subsidized designations by share (66.5% and 54.3%): being rated on a premodernization map is itself a subsidy marker.
The claims linkage: the subsidy sits where the losses have been
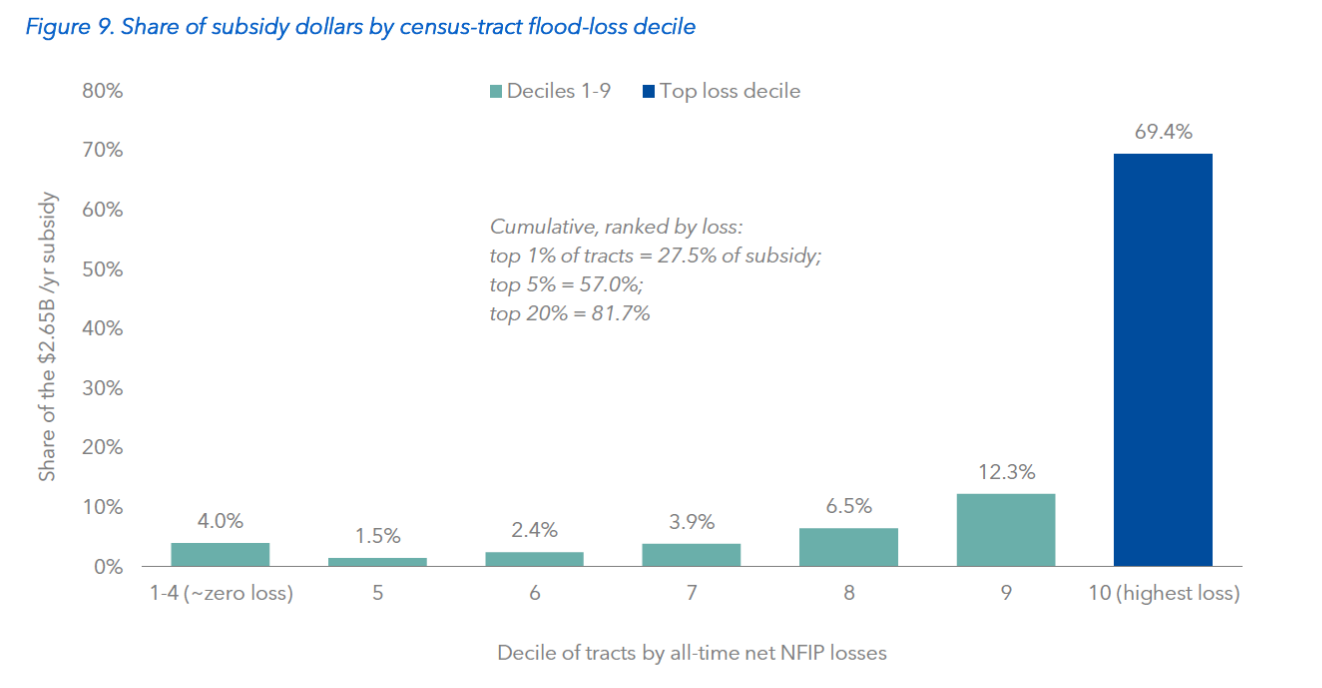
Figure 9 carries the most consequential finding in the report. Joining every in-force policy to all NFIP claims from 1978 through 2026 at the census-tract level, the top decile of tracts by historical losses holds 69.4% of current subsidy dollars (64.8% ranked on last-ten-year losses). Zero-claims tracts hold 2.2% ($58.7mm). The top 100 repeat-claims tracts are 51.1% subsidized at an average gap of $1,880: many years into reform, the most repetitively flooded tracts in America remain more subsidized than average.
The subsidy tracks recent losses, not history. Louisiana has more all-time NFIP losses than Florida ($20.9bn vs. $19.3bn) yet a fifth of its subsidy; $15.5bn of Florida’s losses came in the last ten years (Ian, Helene, Milton). The implication should be stated plainly: phasing out the remaining subsidy means raising prices exactly where flooding happens.
Who holds it: the glidepath is not means-tested
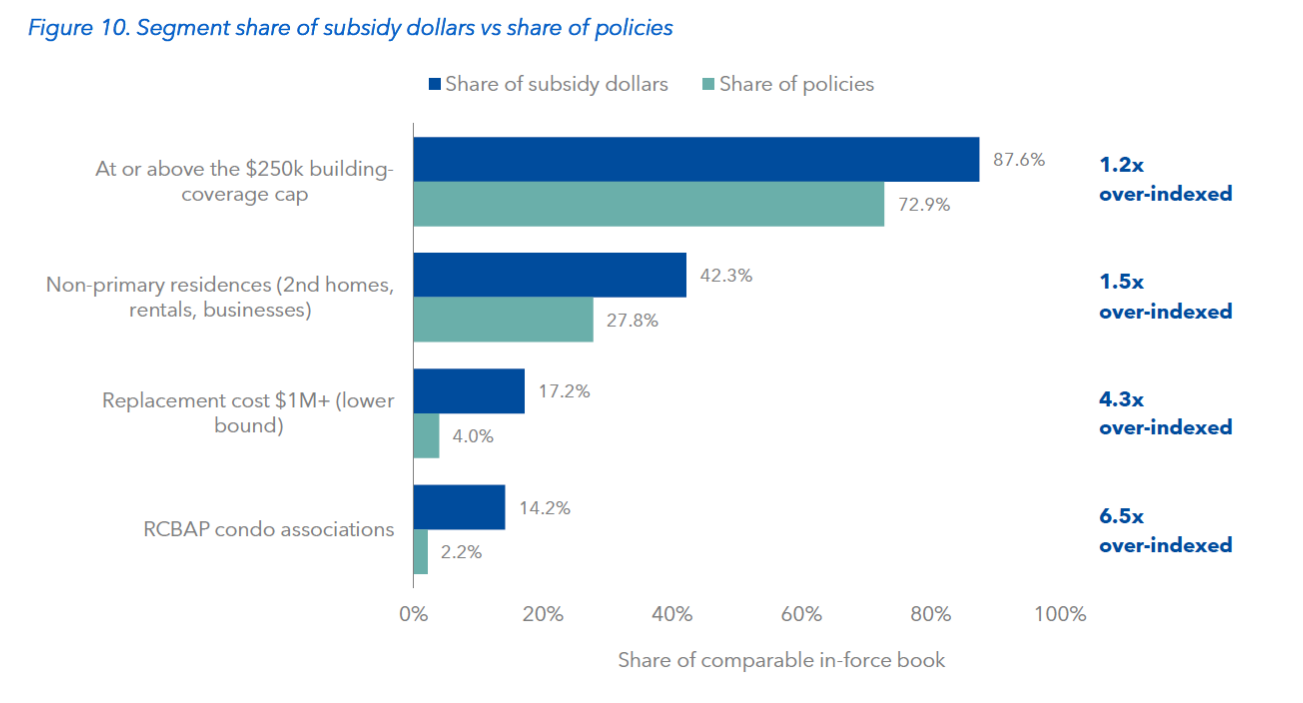
Figure 10 shows non-primary properties (second homes, rentals, businesses, condo associations) hold 42.3% of subsidy dollars ($1.1bn) on 27.8% of policies, receiving $2,835 per year on average, 2.1x a primary residence. Properties with replacement cost above $1mm are 4.0% of the book but hold at least 17.2% of the subsidy (a lower bound; value is unreported on 38.5% of the book), and both subsidized share and discount depth rise with value. The most-subsidized identifiable segment is non-primary single-family homes worth $1mm-plus: 68.4% subsidized, paying less than half their full-risk cost in aggregate. Meanwhile the flat fee stack is regressive: the cheapest fifth of policies pay 34.0% of their bill in fees and surcharges versus 19.3% for the most expensive fifth. The glidepath is not means-tested.
The other side of the ledger: what low-income policyholders actually receive
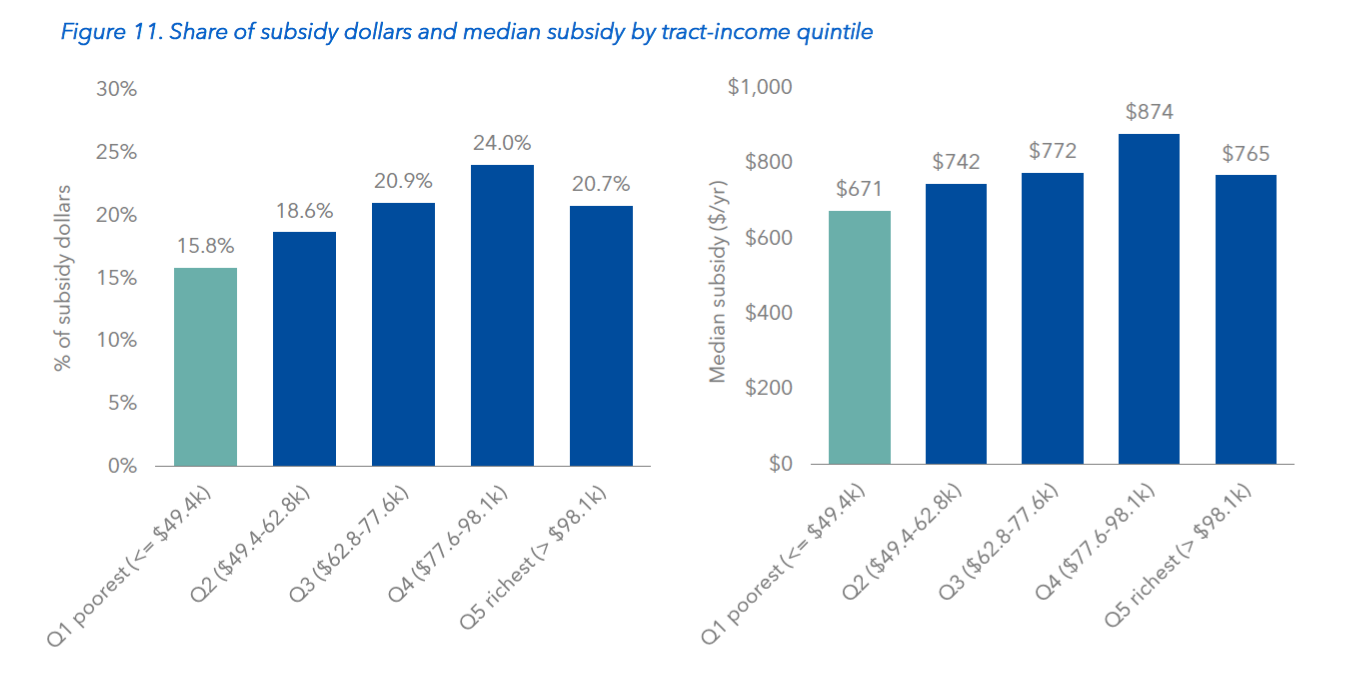
Joining every in-force policy to its census tract’s median household income (ACS 2016-2020) answers the affordability question directly. Figure 11 shows the poorest fifth of tracts holds 15.8% of the $2.6bn, $419.1mm per year, the smallest share of any quintile, at the lowest subsidized incidence (39.9% vs. 44.1% nationally), the lowest median per subsidized policy ($671), and the shallowest effective discount (27.2% vs. 33-36% for the upper three quintiles). Every measure rises with tract income through the fourth quintile, which holds the most ($635.1mm, 24.0%). The subsidy is a middle- and upper-income-tract phenomenon that under-weights the bottom, not a poverty program.
The political cell is smaller still. Primary residences in bottom-quintile tracts, the low-income homeowner the affordability debate invokes, hold $214.1mm, 8.1% of the dollars, at a median of $597 per subsidized policy, and 57.7% of them receive no subsidy at all: the median such home’s discount is $0. Nearly half of what does flow to poor tracts protects no one’s primary home. $205.0mm of the bottom quintile’s $419.1mm goes to second homes, rentals, and businesses, which are more common in poor tracts than in the book at large (36.8% of policies vs. 27.8%), not less. The richest fifth’s primary residences alone ($341.3mm) out-collect the poorest fifth’s by 1.6x, and the in-data cross-check agrees: primary homes buying less than the $250k coverage cap hold 8.8% of the dollars ($234.4mm, median $487).
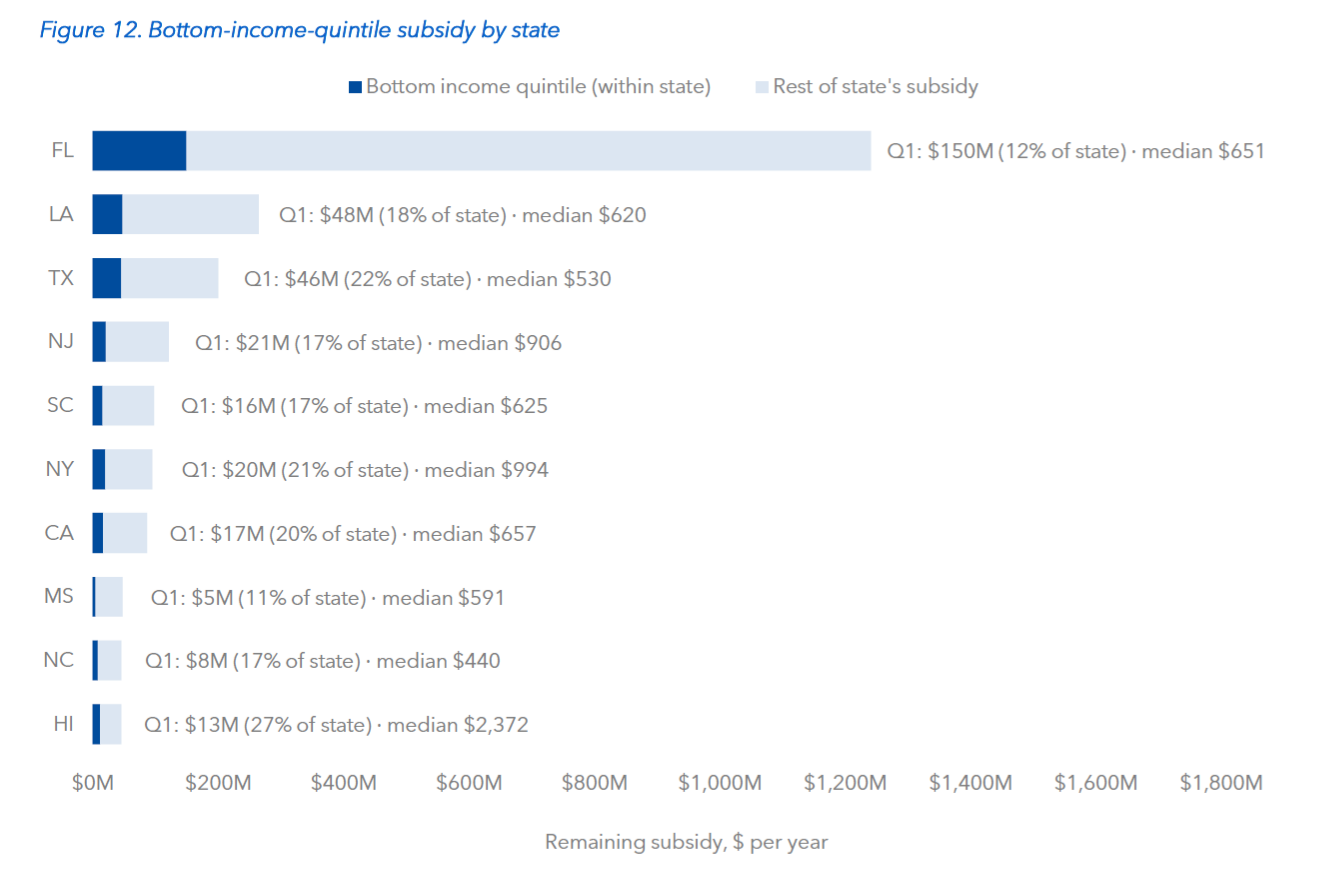
The pattern holds inside every state. Figure 12 shows that the poorest fifth of each top-10 state’s tracts holds 11-27% of that state’s subsidy dollars, and Florida, the subsidy’s center of gravity, is the most skewed at 11.9%. West Virginia and Kentucky, the poor-riverine cases the affordability argument leans on, are real but small: deep discounts on tiny books, roughly $8mm of deep-discount subsidy each. The individual contrast is the sharpest way to say it. If the glidepath ended tomorrow, the median subsidized low-income-tract primary residence would lose $597 per year; the median subsidized $1mm-plus replacement-cost non-primary property would lose $3,002.
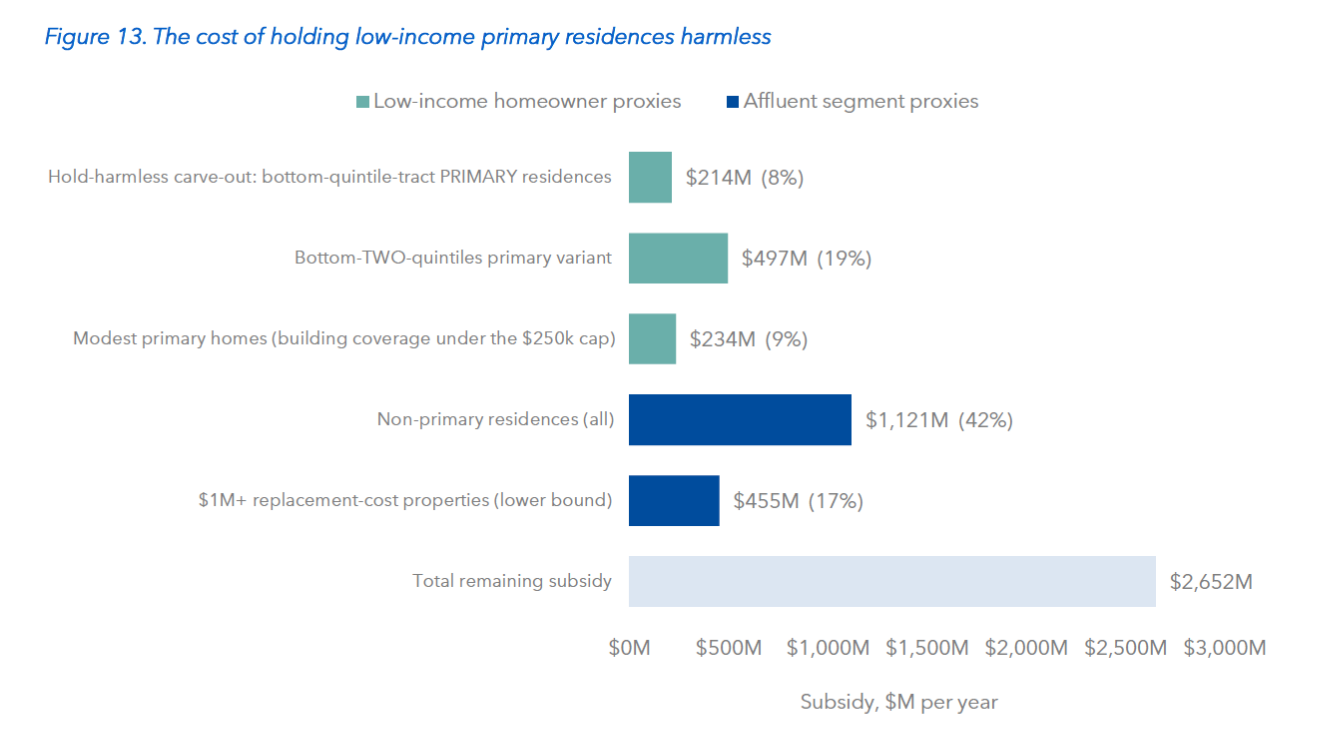
A means-tested carve-out keeping every bottom-quintile-tract primary residence at its current price costs $214.1mm per year, 8.1% of the $2.6bn; extending it to the bottom two quintiles costs $497.0mm, 18.7%. Either is smaller than what the glidepath currently delivers to non-primary properties ($1.1bn) or to $1mmplus properties ($455.4mm, a lower bound). That is the arithmetic behind Section 5’s recommendation: the targeted, means-tested, on-budget affordability assistance proposed there can hold every low-income primary residence harmless for roughly 8% of what the untargeted discount costs today, cheaper than the implicit discount now flowing to any affluent segment of the book.
4. The Run-Off Engine and the Forward Outlook
Over the sixty months through June 2026, $2.5bn per year of subsidy run-rate was closed: $1.4bn (~58%) via renewal repricing and $1.0bn (~42%) via attrition, meaning subsidized policyholders left the program. New and assumed business added back $0.7bn. The bridge runs from roughly $4.4bn per year in July 2021 to $2.6bn today. Note, due to gaps in the FEMA data set, attrition is only observable from April 2023, so its true sixty-month share is understated (plausibly by $0.4-0.7bn).
The current pace over the twelve most recent months is roughly $49.7mm per month closed ($28.4mm repricing, $21.4mm attrition) against $7.7mm per month added.
The attrition share is the difference between a plan and a leak. Roughly 42% of the closed subsidy closed because the policyholder exited, and the data cannot say whether those households bought private coverage or went uninsured. What the data does show is that discounted customers stay: subsidized policies lapse at 7.4% by count versus 13.1% for the full book. The deepest discounts are the least likely to walk away, which is why the subsidy shrinks slowly.
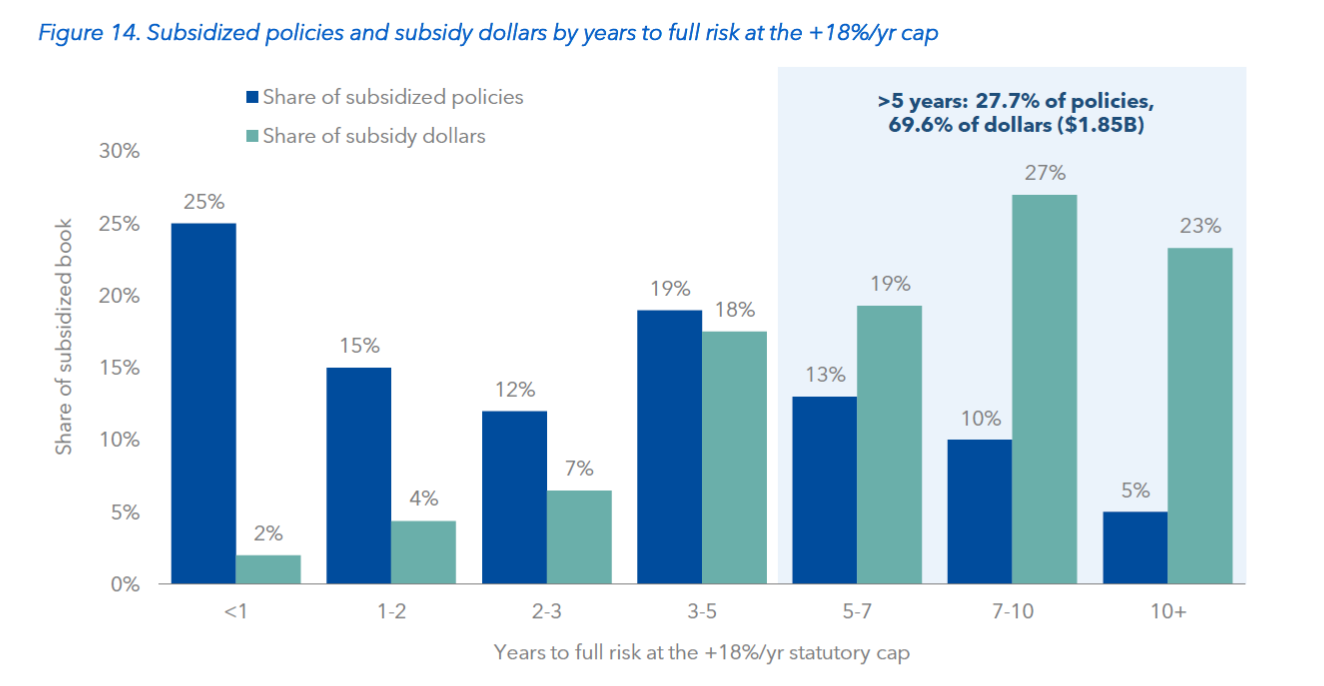
Figure 14 shows 25.4% of subsidized policies clear their gap within one renewal but hold only 1.9% of the dollars, while 424.3k contracts are more than five years from full risk (27.7% of subsidized) and hold $1.8bn of subsidy, 69.6% of the dollars. The ten-plus-year cohort (72.0k policies, $0.6bn) carries a median 84.7% discount; the median such policy pays $1,171 against an $8,104 full-risk cost and stays below full risk into the late 2030s.
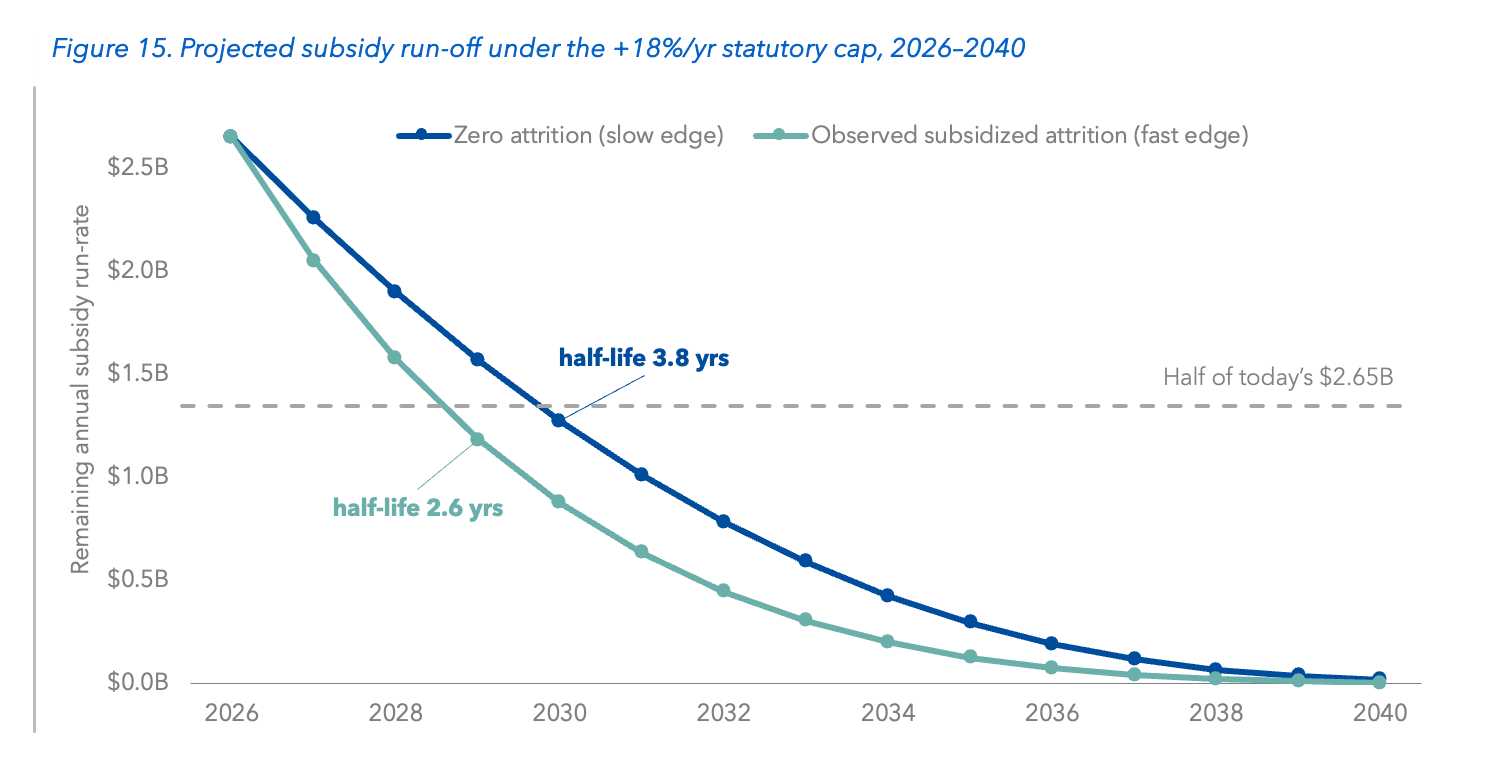
Figure 15 rolls the book forward under current law, compounding every subsidized policy at the +18% cap. This is a projection of current law, not a forecast of FEMA policy: full-risk premiums are held static, and no new subsidized entrants are assumed ($92mm per year is currently being added). On those mechanics, the $2.6bn run-rate halves in 3.8 years with zero attrition (2.6 years at observed attrition), falls below $0.5bn during 2032-2034 and below $0.1bn during 2036-2038, and the cumulative subsidy is $10.2-13.2bn undiscounted, most of it by 2032.
The endgame is even more Floridian than the present: at the projection’s roughly $0.4bn point in mid-2034,
Florida’s share rises from 47.4% to 60.4%. And visible extremes persist to the end. Two anonymized in-force
examples, current versus full-risk annual cost: a Florida AE single-family home at $856 against $10,200, and a
Florida AE condo building at $5,999 against $71,556.
5. Implications and Recommendations
The glidepath is working. The median policy is at full risk, the at-full-risk share has nearly tripled since January 2022, and $2.5bn per year of subsidy has closed in five years. Risk Rating 2.0 was directionally right and FEMA has executed it, including pricing genuinely new business at full risk from day one. The problem is program design, not execution: a statutory cap that guarantees a decade-plus tail, concentrated in the highest-loss geography in the country, held disproportionately by non-primary and high-value properties, and transferable at property sale.
The subsidy flows uphill. This is a transfer to property owners, and disproportionately to the wealthiest among them. Second homes, rentals, and businesses hold 42.3% of the dollars on 27.8% of the policies, collecting $2,835 per subsidized policy against a primary residence’s $1,347. Properties worth over $1mm are 4.0% of the book but hold at least 17.2% of the dollars, and both the share subsidized and the depth of discount rise with property value. The single most-subsidized segment in the entire program is million-dollar-plus second homes: 68.4% of them pay below cost, and in aggregate they pay less than half their full-risk price. Meanwhile the flat fee stack takes 34.0% of the bill from the cheapest fifth of policies versus 19.3% from the most expensive fifth. A program backed by taxpayer exposure is charging its smallest policies the heaviest fees while granting its deepest discounts to its most valuable properties. No affordability program would be designed this way.
The remaining transfer is a bounded number, which changes the policy conversation. NFIP subsidization now costs $2.6bn per year, declining on a 2.6-3.8-year half-life, with $10-13bn to go. Neptune Research Group’s October 2025 “Path Forward” proposal (keep renewing existing customers on their glidepath, stop writing new NFIP policies, narrow the residual safety net) caps the taxpayer-borne exposure at exactly that measured pace while opening the contestable majority to the private market.
The geography has to be dealt with directly. Phase-out means double-digit annual increases concentrated on Fort Myers, Naples, and the Louisiana bayou parishes, falling on the program’s longest-tenured customers. That argues for pairing the wind-down with targeted, means-tested, on-budget affordability assistance for primary residences, in place of an implicit 31% discount that travels with the deed. That assistance is affordable by construction: holding every low-income-tract primary residence harmless costs $214.1mm per year, roughly 8% of the current subsidy and less than a fifth of what flows to non-primary properties today. The program already carries $22.5bn in Treasury debt from the last era of underpricing; the case for not rebuilding that balance is already made.
The glidepath finishes its work during 2036-2038 on current law with or without reform. What Congress controls is who bears the $10-13bn between now and then, whether departing policyholders land in private coverage or bare exposure, and whether the majority already paying a true risk price is opened to a market that can serve it.
