The 2026 Harris County Flood Map Update: A Market Correction and a Step Toward Closing the Coverage Gap
7 min read · Mar 4, 2026
Executive Summary
For nearly 20 years, FEMA’s flood maps in Harris remained largely unchanged, leaving homeowners with an incomplete picture of their true flood risk. Hurricane Harvey proved it: roughly 70% of flooded homes sat outside the officially mapped high-risk zone.1 The new draft maps proposed for Harris County, released in February 2026, represent a step forward in aligning public policy with the region’s actual hydrological risk.
What the proposal does:
- Significant Expansion of High-Risk Zones: The 100-year floodplain (Special Flood Hazard Area) is projected to expand by approximately 50,000 acres, increasing from 150,000 to 200,000 acres, a 33% increase in high-risk designation areas.2
- Mandatory Growth of the Insured Base: This reclassification will move over 170,000 properties and $50 billion in real estate assets into the high-risk designation, requiring flood insurance for homeowners with federally backed mortgages. This shift is essential for growing the insured base and ensuring financial protection against future disasters. As of February 2026, 82% of Harris County’s housing stock remains uninsured.
- Updated Science Behind the Maps: The new maps are built on modern rainfall data and modeling that reflects how storms like Harvey actually behave, not the outdated assumptions from nearly 20 years ago.
- Increased Consumer Awareness: The release of these maps serves as a vital “red flag” for the community, increasing transparency and helping residents better understand their physical and financial exposure.
Updated maps don’t create new risk, they reveal risks that already exist. This problem extends far beyond Harris County and is systemic nationwide, with millions of properties facing meaningful flood risk while falling outside officially designated high-risk zones. Research from the First Street Foundation estimates 10 million high-risk properties fall outside FEMA’s official maps nationwide.
By combining updated public maps with AI-driven private-sector tools that provide instant, property-level risk assessments, communities can move toward a more resilient future where every property owner has the information needed to make risk-based decisions.
The 50,000-acre expansion of Harris County’s high-risk flood zones is a long-overdue alignment with the region’s actual risk. By leveraging newer technology to reflect modern rainfall realities, these maps provide a critical ‘red flag’ that increases consumer awareness and drives the mandatory insurance adoption necessary to protect Houston’s homeowners. Our mission is to close the national coverage gap, and this update is a vital step toward a more resilient and better-insured Houston.
— Trevor Burgess, CEO, Neptune Flood
What Hurricane Harvey Exposed
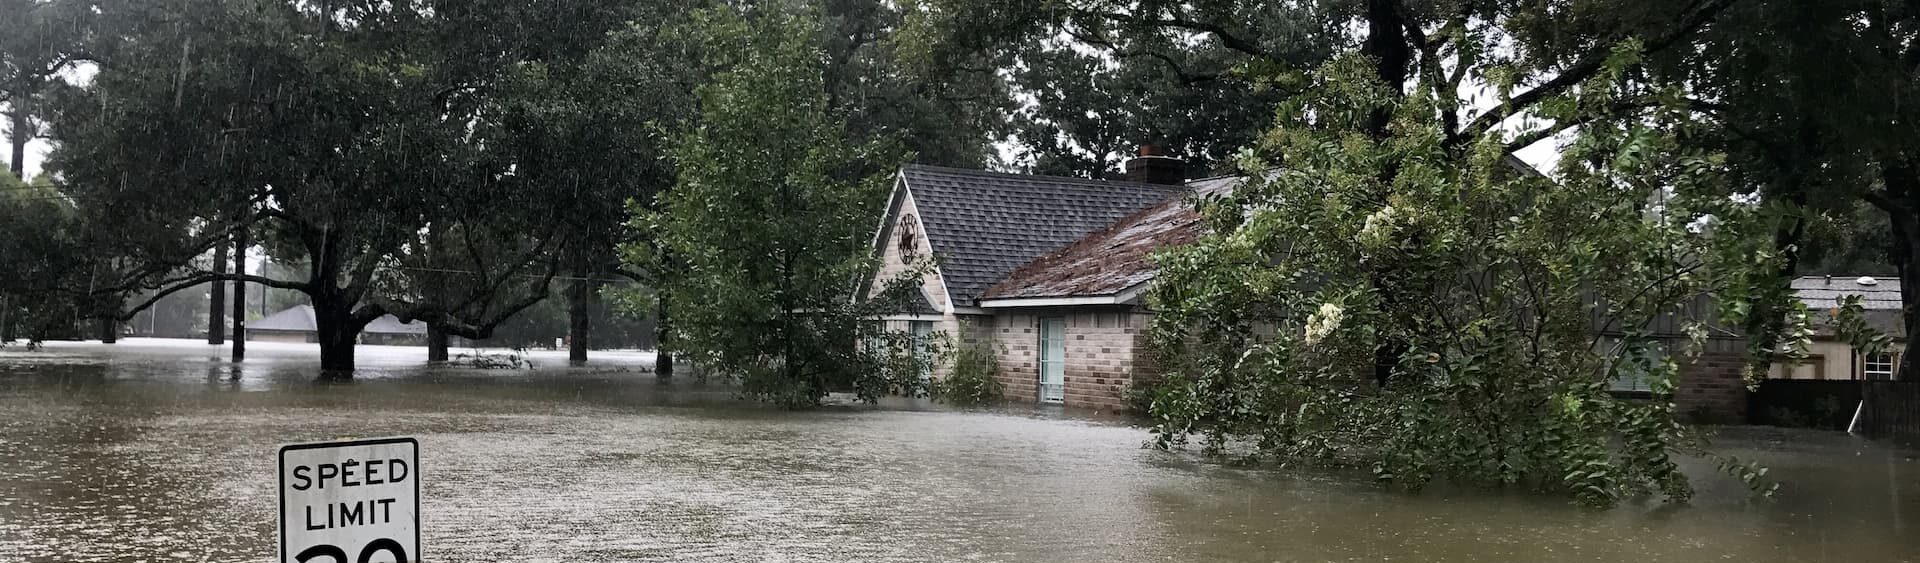
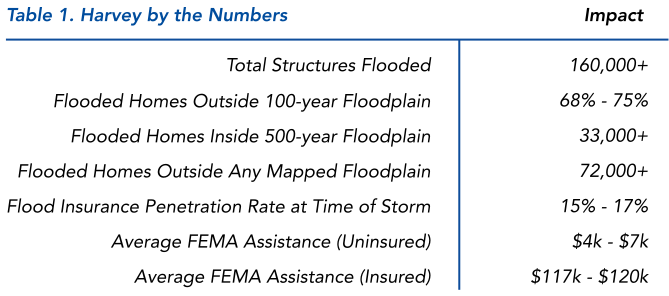
Hurricane Harvey was a defining moment for Southeast Texas, depositing between 40 and 60 inches of rain over a four-day period in 2017.3 Approximately 160,000 homes flooded in Harris County. The defining failure wasn’t the storm itself, it was the maps.4 At the time, Harris County’s Flood Insurance Rate Maps (FIRMs), the official FEMA maps that determine which properties are classified as high-risk and where flood insurance is required, were largely based on studies conducted around 2007, utilizing rainfall estimates that have since been proven obsolete.
The consequences were staggering:5
- ~160,000 homes flooded in Harris County during Harvey.
- Nearly three-quarters of those were outside the 100-year floodplain, the high-risk zone where FEMA estimates at least a 1% annual chance of flooding, and where flood insurance is required for federally backed mortgages. These homeowners had no mandate to carry coverage.
- ~33,000 were in the 500-year floodplain, areas with a 0.2% annual chance of flooding and no insurance requirement.
- ~72,000 were outside any mapped floodplain entirely, where the maps said flood risk was essentially nonexistent.
The reason was straightforward: the maps were built on outdated rainfall data and one-dimensional models that only tracked water in channels. They didn’t account for pluvial (urban) flooding, which happens when localized rainfall overwhelms streets, parking lots, and drainage systems.
The human cost was severe. Homeowners outside the mapped floodplain had largely opted out of coverage, believing their risk was negligible. When floodwaters arrived, they received an average of $4,000 to $7,000 in FEMA assistance.6 Those with flood insurance policies received $120,000 on average.7 The gap between insured and uninsured recovery is not marginal. It’s the difference between rebuilding and financial ruin.
Despite these lessons, Texas remains critically underinsured. Today, only 6% of residential properties statewide carry flood insurance, and in major inland counties like Dallas, Bexar, and Tarrant, penetration drops below 1%.
The Proposed Maps: What’s Changing and Why
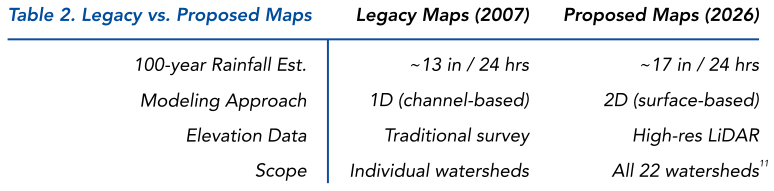
The proposed maps were developed through FEMA’s Modeling, Assessment and Awareness Project initiative (MAAPnext), a joint effort with the Harris County Flood Control District that remodeled all 22 of the county’s watersheds from scratch.8 Unlike previous updates that were incremental, this is a complete overhaul, the first since the mid-2000s.9
Three things changed:
- How rainfall is measured. The old maps assumed a 100-year storm would drop about 13 inches of rain in 24 hours. The new maps use NOAA Atlas 14 data, which puts that number closer to 17 inches, a 30% increase. Harvey dumped 40–60 inches. The old baseline was simply too low.
- How water movement is modeled. Legacy maps tracked water flowing through bayous and channels (known as one-dimensional modeling). The new maps simulate how water actually moves across flat ground, collects in streets, and pools in low-lying neighborhoods, including “ponding” areas where water accumulates during a storm even if they’re not near a waterway (two-dimensional modeling).
- How terrain is mapped. High-resolution LiDAR elevation data replaces older survey methods, giving engineers a far more precise picture of where water will go.
The result is a 100-year floodplain that grows from roughly 150,000 to 200,000 acres. ROAR Partners estimates that over 170,000 additional properties (representing approximately $50 billion in real estate assets) will be designated as high risk.10 Homeowners with federally backed mortgages in those areas will be required to purchase flood insurance.
The draft maps are currently in FEMA’s technical review phase, with floodplain administrators and local officials reviewing the data first. A formal public comment and appeals process will follow, during which property owners can challenge proposed changes. As a result, the full update could take two to three years before the maps become final and enforceable.12
The Bigger Picture: A National Coverage Gap
Harris County isn’t an outlier, it’s a case study. Official FEMA maps identify approximately 7.9 million properties nationwide as high-risk. Independent research by the First Street Foundation puts the real number at over 17.7 million (as of 2023).13 That’s nearly 10 million properties with meaningful flood risk that sit outside official maps and bypass mandatory insurance requirements.
The cost of that gap is real. Altogether, 13 million high-risk properties in the U.S. remain uninsured or significantly underinsured. In Harris alone, over one million residential structures remain uninsured (82% of the total housing stock). Yet, 56% of all NFIP claims in Harris came from properties outside designated high-risk zones, homeowners who were told they were safe and made financial decisions accordingly.
When maps understate risk, the burden doesn’t disappear. It shifts to individual families who can’t rebuild, and to taxpayers who fund disaster relief. Closing the coverage gap starts with getting the maps right.
Why Better Maps Are Good for Markets
Flood map updates correct a misunderstanding, miscommunication, and mismeasurement of risk. And when risk is understood, communicated, and measured accurately, markets operate more efficiently.
A Larger Insured Base
The most immediate effect of updated maps is growth in the insured base. Every property reclassified into the high-risk zone with a federally backed mortgage must carry flood insurance. The 15–17% insurance penetration rate in Harris County at the time of Harvey left the vast majority of homeowners exposed.
The need is growing more urgent. NFIP policies in force in Harris County have declined by approximately 31%, roughly 110,000 fewer policies, over the past five years (see Figure 1).14 Updated maps and an expanded mandatory purchase zone are the single most direct way to reverse that trend.
This isn’t hypothetical. In 2024, Broward County, Florida revised its flood maps and reclassified over 88,000 properties into higher-risk categories.15 Within a year of the update, residential flood insurance penetration jumped from 20% to nearly 27%.16
Smarter Real Estate Decisions
Transparent risk information makes real estate markets more efficient. In Harris County, homes in the 100-year floodplain sold at a 2.3% discount, even before Harvey.17 Afterward, the discount grew to 5.5% as buyers updated their understanding. Accurate maps mean buyers, sellers, and lenders price flood risk into transactions.
Private Market Opportunity
As the mapped floodplain expands and awareness grows, the addressable market for private flood insurance grows with it. In Texas alone, between $250 million and $300 million in premiums could be transferred from the NFIP to private carriers at lower prices. As outlined in a Neptune Research Group report,18 private carriers have structural advantages that the NFIP does not. They can price risk at the individual property level rather than by zone, reward mitigation with lower premiums, and deliver coverage through digital platforms that quote in seconds rather than days. As more properties enter the mandatory purchase zone, homeowners and lenders will increasingly look to private options that offer better pricing, faster service, and broader coverage terms.
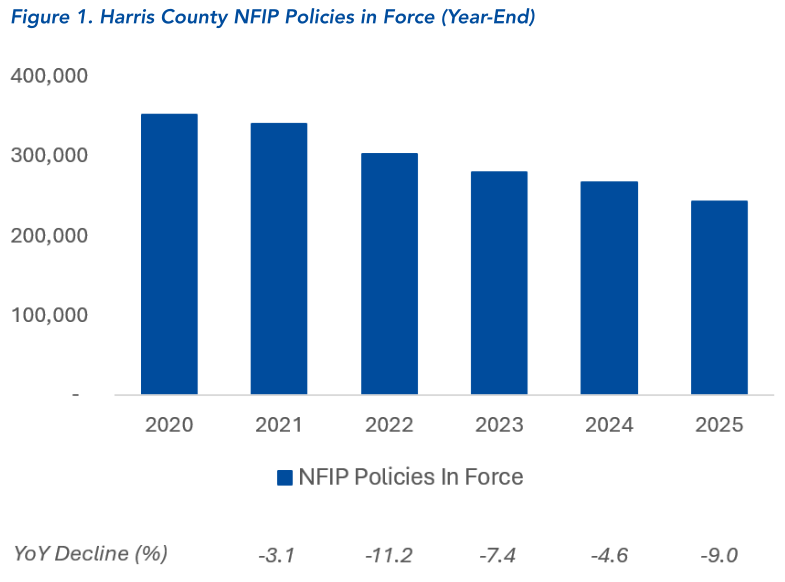
Source: OpenFEMA Dataset – FIMA NFIP Redacted Policies
Conclusion: Better Maps, Bigger Markets
The Harris County flood map update is a correction two decades in the making. By expanding the 100-year floodplain by 50,000 acres, FEMA is more closely aligning its maps with the flood risk revealed by Harvey in 2017.
The implications are straightforward: more properties in the Special Flood Hazard Area means more mandatory policies, a larger insured base, and significant growth for the flood insurance market. It means greater awareness for homeowners, lenders, and communities that have operated for years with an incomplete picture of their exposure. And it means better risk-based decisions at every level, from the family buying a home to the bank writing the mortgage.
Sources
- [1] Harris County Flood Control District – Hurricane Harvey
- [2]FEMA Draft Flood Maps for Harris County: JRH Engineering
- [3] Hurricane Harvey Info. National Weather Service
- [4] Houston Flood Insurance Guide: Flood Insurance Guru
- [5] Houston Chronicle: New Flood Maps Texas
- [6] Urban Institute: Harris County
- [7] OpenFEMA – FIMA NFIP Redacted Claims
- [8] KHOU – FEMA Flood Maps
- [9] Economic Times: Houston Flood Maps Update
- [10] Future Proofing America – Strategic Briefing
- [11] Halff Associates – Harris Flood Control
- [12] Houston Chronicle – Drafts of Harris County Maps Offer Preview
- [13] The First Street Foundation: The Precipitation Problem
- [14] OpenFEMA Dataset – FIMA NFIP Redacted Policies
- [15] Broward County FEMA Flood Zone Revision
- [16] OpenFEMA Dataset: NFIP Residential Penetration Rates
- [17] Freddie Mac: Examining Changes in Home Prices in Harris County
- [18] Neptune Research Group – Transitioning NFIP Policies to the Private Market
