California Underwater: A Blind Spot in the Golden State
13 min read · Apr 13, 2026
Executive Summary
While wildfires and earthquakes dominate California’s disaster narrative, flooding represents a persistent and often overlooked threat. With nearly 2.3 million properties at risk of flooding over the next 30 years, and more than 110,000 expected to flood with near certainty, California faces a growing insurance shortfall that threatens the state’s flood resilience.
California’s True Flood Risk
- Of the 2.3 million properties at risk, 1.1 million face at least a 1% annual chance of flooding.
- By comparison, FEMA Flood Insurance Rate Maps (FIRMs) identify only 495,000 properties at this same risk level.
- Modern flood modeling therefore identifies more than 2.2x as many at-risk properties, uncovering nearly 600,000 additional properties currently outside FEMA-designated high-risk zones, a gap expected to widen over time.
Drivers of Flood Risk in California
- Atmospheric rivers, which deliver approximately 30–50% of California’s annual precipitation, are the primary driver of the state’s most damaging flood events.
- Urbanization amplifies pluvial flood risk. Approximately 94% of residents live in urban areas, the highest urbanization share in the nation.
- Older housing stock increases vulnerability, with nearly 70% of the National Flood Insurance Program (NFIP) policies covering Pre-FIRM homes built before modern flood mapping and construction standards.
- High rebuilding costs magnify losses, as California’s median home value is roughly twice the national median.
- Post-wildfire conditions sharply increase flood risk, with elevated runoff and erosion persisting for five years or more, and in recently burned areas, as little as half an inch of rainfall per hour can trigger debris flows.
- Earthquake-focused housing design can conflict with flood resilience, as wood-frame, low-rise homes built close to grade perform well during seismic events but are often more vulnerable to flood damage.
The Cost of Inaction
- California is the most flood-prone state on the West Coast. Since 1978, the NFIP has paid roughly $1.4 billion in flood losses, adjusted for inflation.
- Nearly two-thirds of NFIP losses occurred in just ten counties, where only 2.7% of residential properties carry flood insurance.
- 45% of NFIP claims in California have occurred outside FEMA-designated Special Flood Hazard Areas (SFHAs), where insurance is often not required.
- Despite this, only 34% of NFIP contracts in force are located outside FEMA-designated high-risk zones, materially lower than in other flood-prone states such as Texas (66%) and Louisiana (50%).
California’s Widening Coverage Gap
- NFIP participation in California has declined by 35% since 2016, even as flood losses and flood events have continued to rise.
- Residential flood insurance penetration is just 1.4% statewide, rising to only ~31% within SFHAs.
- As participation has declined, average NFIP premiums have increased by more than 33%, driven by FEMA’s transition toward actuarially accurate pricing. In many areas, flood insurance premiums can consume 5–8% of household income, while coverage limits often fall far short of rebuilding needs.
- With median home values of $750,000–$800,000, NFIP building limits of $250,000 often represent less than half (and in some cases less than one-third) of the true cost to rebuild.
Flood Risk in California’s Shadow
When people think about natural disasters in California, two risks dominate the conversation: wildfires and earthquakes. Yet, despite one in ten homes facing substantial flood risk, flooding rarely makes the list.
That omission is not because floods are rare or inconsequential. In fact, flooding has caused some of the most damaging disasters in California’s history and continues to generate billions of dollars in losses. Unlike many of the states with the highest flood losses, California’s flood risk is not driven by hurricanes, but by recurring, non-tropical events: including riverine flooding, intense rainfall, and atmospheric rivers, making it one of the most flood-exposed non-hurricane states in the country.
Because flood risk lacks the headline presence of fires and the ever-present fear of earthquakes, it is often treated as a temporary disruption rather than a core, persistent threat. When flood risk is overlooked, insurance coverage tends to lag reality. Many households in California either lack flood insurance altogether or rely on coverage limits that fall well short of the true cost to rebuild, an especially acute issue in a state with some of the highest home values and construction costs in the nation.
In the sections that follow, we examine how flood risk has evolved in California, the drivers behind that risk, where coverage gaps are most pronounced, and why existing insurance structures struggle to meet the state’s needs.
A History of Flooding in California
Flooding is not a new or emerging threat in California. As the West Coast’s most flood-prone state, it has shaped the state’s geography, infrastructure, and development patterns for more than a century.
The Great Flood of 1862
The Great Flood of 1862 remains the most destructive flood event in California’s recorded history.
- Weeks of continuous rainfall inundated the Central Valley. San Francisco and Sacramento recorded 34 and 37 inches of rain respectively, over the course of two months.
- The floods were estimated to have cost at least 4,000 lives and $50–100 million in damages at the time (approximately $3 billion in today’s dollars). An estimated one-quarter of the state’s economy was destroyed.
Flood Risk in California is Persistent and Cumulative
Flooding in California is not defined by one catastrophe, but by frequent, severe events occurring over many years. This pattern repeats in modern form through recurring winter storms, river flooding, levee failures, and atmospheric river events.
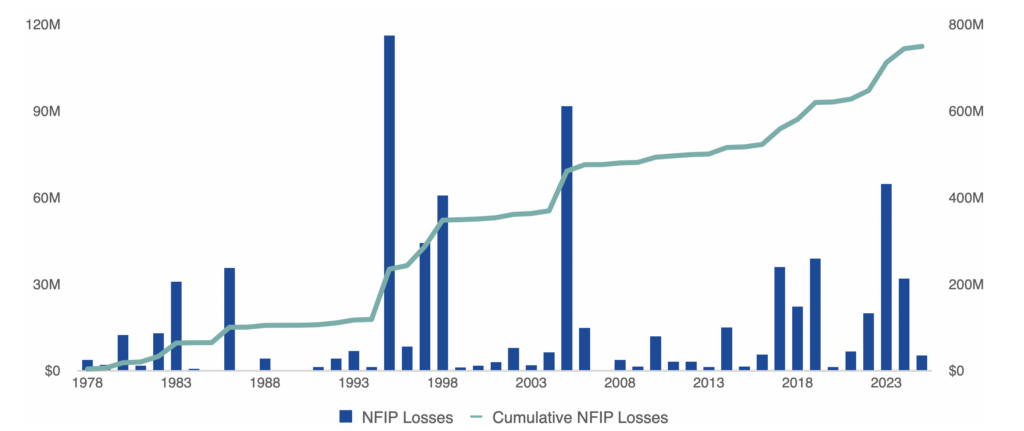
The National Flood Insurance Program (NFIP), which holds over 80% of policies nationwide, has paid approximately $1.4 billion in inflation-adjusted flood losses in California since 1978. While the five worst flood years account for about 50% of total paid losses, the other half is distributed across many years of moderate flooding, highlighting the cumulative nature of flood risk in the state.
- 1986 – Northern and Central California Floods: Nearly $36 million in NFIP paid losses. Total statewide damages are estimated at $720 million, with close to 15,000 buildings destroyed.
- 1995 – Winter Flooding: The largest NFIP loss year on record in California, with more than $116 million in paid losses and over 8,200 claims. NOAA estimates over $3 billion in total damages.
- 1998 – El Niño Winter Flooding: A series of storms generated roughly $61 million in NFIP paid losses across nearly 7,000 claims, with total damages estimated at $550 million statewide.
- 2005 – Winter Storms: Severe winter storms caused an estimated $300 million in damages.The NFIP paid approximately $92 million in losses.
- 2023 – Atmospheric River Clusters: Back-to-back events resulted in over $3 billion in total damages statewide. The NFIP paid roughly $65 million across more than 1,800 claims.
Figure 1. NFIP Flood Losses in California Show Persistent, Cumulative Impacts Over Time (Nominal Dollars)
Source: OpenFEMA Dataset – FIMA NFIP Redacted Claims
The Drivers of Flood Risk in California
California’s flood losses are driven by a set of structural and environmental factors that repeatedly produce damaging flood events across the state.
Atmospheric Rivers
Atmospheric rivers are long, narrow bands of water vapor that travel from the tropics toward the U.S. West Coast. The average atmospheric river carries an amount of water vapor equivalent to the average flow of water at the mouth of the Mississippi River (at their strongest, they can transport up to 15 times that amount). When these systems reach California, the moisture cools and condenses into rain and snow.
Atmospheric rivers account for approximately 30–50% of California’s annual precipitation, making them essential to the state’s water supply. At the same time, they are the primary driver of California’s most damaging flood events.
Flood risk increases most sharply when atmospheric rivers:
- Deliver intense rainfall over short periods (e.g., 1983, 1995)
- Strike already saturated watersheds (e.g., 1998 El Niño storms)
- Combine with existing snowpack, accelerating runoff (e.g., 1997 New Year’s Flood)
- Arrive in rapid succession and clusters, overwhelming rivers and reservoirs (e.g., 2017, 2023 storm clusters)
Snowmelt and Rain-on-Snow Events
Snowmelt amplifies flood risk across inland California, particularly in the Sierra Nevada and downstream river systems. Flooding is most severe when warm storms bring rain onto existing snowpack, rapidly increasing runoff into rivers and reservoirs. This dynamic played a central role in several of California’s highest-loss flood years, as rain-on-snow events increase both flood depth and duration.
Urbanization and Pluvial Flooding
Flood risk in California is increasingly shaped by urbanization. As cities expand, natural drainage is replaced by impervious surfaces such as roads, rooftops, and parking lots, increasing runoff and overwhelming stormwater systems during heavy rain.
- California’s rapid urbanization amplifies pluvial flood risk. Approximately 94% of residents live in urban areas, the highest urbanization share in the nation. California added nearly 1.9 million urban residents between 2010 and 2020.
- Studies show that urban development can increase runoff volumes by two to five times compared to natural landscapes.
- As a result, damaging flooding increasingly occurs outside traditional river floodplains, particularly in dense urban areas where risk may be under-mapped and poorly understood.
Aging Infrastructure and Housing Characteristics
Flood risk in California is also shaped by the condition of infrastructure and the characteristics of its housing stock.
- Much of California’s infrastructure was built decades ago, with nearly 70% of NFIP policies in California covering pre-FIRM homes (properties built before FEMA’s first flood maps and modern flood standards), highlighting the concentration of flood risk in older, more vulnerable structures.
- Flood losses are further amplified by the high cost of rebuilding, with California’s median home value about twice as expensive as the national median.
- California’s housing stock reflects a long-standing focus on earthquake resilience, which can conflict with flood resilience. Wood-frame construction, low-rise structures, and homes built close to grade perform well during seismic events but are often more vulnerable to flood damage. By contrast, flood-resilient design typically favors elevated living spaces, flood-resistant materials, and greater separation between ground level and habitable areas.
Wildfire and Post-Fire Flood Risk
Wildfires significantly increase flood risk in California, particularly in the months and years following major burn events.
- Wildfires remove vegetation that normally absorbs rainfall and stabilizes soil, sharply increasing runoff and erosion. Post-fire flood risk can persist for five years or more, and in recently burned areas, as little as half an inch of rainfall per hour can trigger debris flows.
- Extreme heat associated with wildfires can create hydrophobic (water-repellent) soils, reducing infiltration and accelerating runoff, causing rainfall to behave more like water flowing over pavement than natural ground.
- With five of the ten largest wildfires in California history occurring since 2017, even moderate storms now pose heightened risks of flash flooding, debris flows, and mud flows.
Flood Exposure and Gaps Across California
Flood risk in California spans inland valleys, coastal communities, and major metropolitan areas.
According to the First Street Foundation, 2.3 million properties in California are at risk of flooding over the next 30 years. Of these, 1.1 million properties currently face substantial flood risk, defined as a 1% annual chance of flooding. By comparison, FEMA Flood Insurance Rate Maps (FIRMs), the official maps used to identify high-risk flood zones for insurance and regulatory purposes, identify approximately 495,400 California properties as having this same level of flood risk.
Modern flood modeling paints a materially different picture:
- The First Street Foundation identifies more than 2.2 times as many properties at substantial flood risk as FEMA maps, uncovering nearly 600,000 additional properties currently outside FEMA-designated high-risk zones, a gap expected to widen over time.
- This mismatch highlights a significant gap between where flood risk exists in California and where it is formally recognized, with important implications for risk awareness, insurance participation, building codes, and financial protection.
Where Is Flood Risk Concentrated?
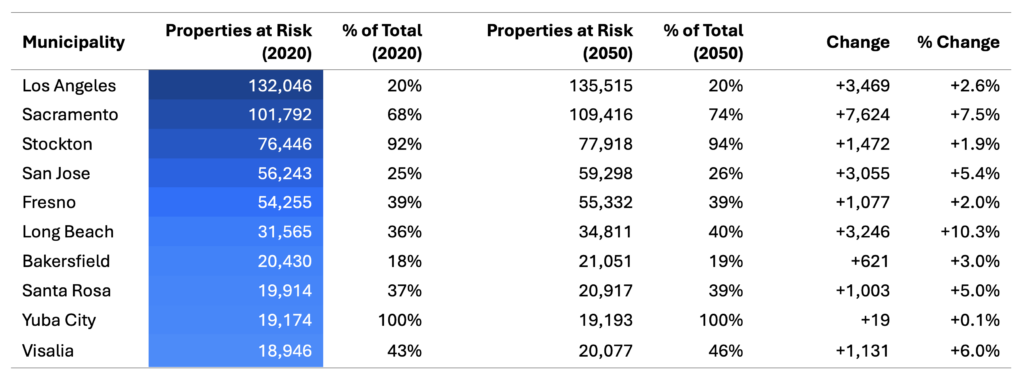
Flood risk in California is widespread. In absolute terms, major metropolitan areas account for the largest number of at-risk properties. In relative terms, smaller municipalities often face flood exposure that affects most, if not all, homes. Table 1 highlights how flood risk in California extends well beyond a handful of coastal zones and is projected to grow across many of the state’s largest municipalities.
Table 1. California Municipalities with the Greatest Number of Properties at Flood Risk
Source: First Street Foundation – The First National Flood Risk Assessment
Where is Flood Damage Concentrated?
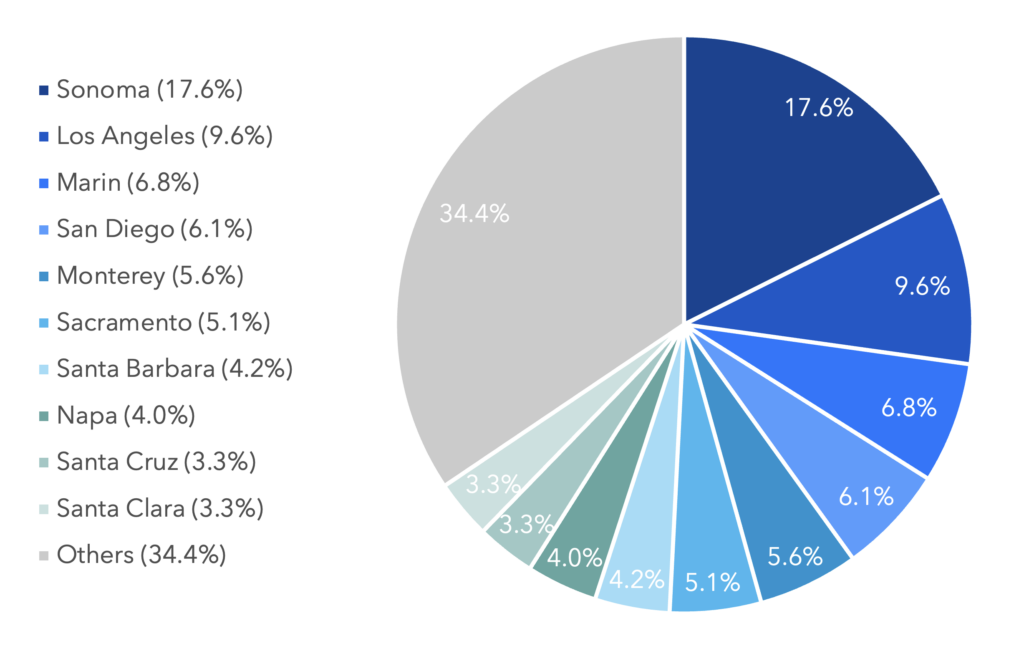
Since 1978, a small group of counties has accounted for a disproportionate share of NFIP flood losses in California (as shown in Figure 2). Sonoma County alone represents nearly 18% of total NFIP payouts statewide, followed by Los Angeles (9.6%), Marin (6.8%), San Diego (6.1%), and Monterey (5.6%).
Collectively, the top ten counties account for nearly two-thirds of all NFIP losses in California, even though only 2.7% of residential properties carry flood insurance.
Figure 2. NFIP Flood Losses in California, by County
Source: OpenFEMA Dataset – FIMA NFIP Redacted Claims
Flood Insurance Participation and Affordability
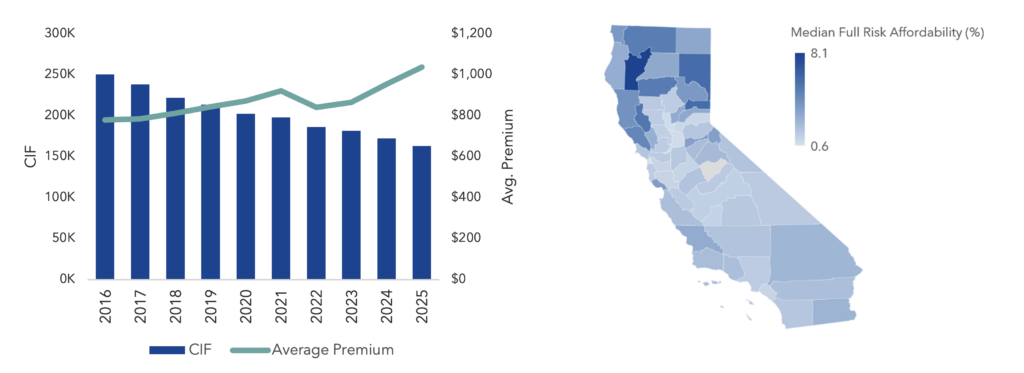
Despite repeated flood losses and increasing flood events, flood insurance participation in California has steadily declined. NFIP contracts in force (CIF), which represent the number of buildings covered, have fallen materially (as shown in figure 3). California’s NFIP participation has trended downward by 35% since 2016. The result is a widening disconnect: more properties face flood risk, while fewer households carry coverage.
Flood Insurance Penetration
The average residential flood insurance penetration in California is just 1.4%, and approximately 31% within FEMA-designated Special Flood Hazard Areas (SFHAs), areas identified by FEMA as having at least a 1% annual chance of flooding. As shown earlier in this report, the true number of properties facing substantial flood risk in California is materially higher than what FEMA flood maps capture, making this coverage gap significantly larger in practice.
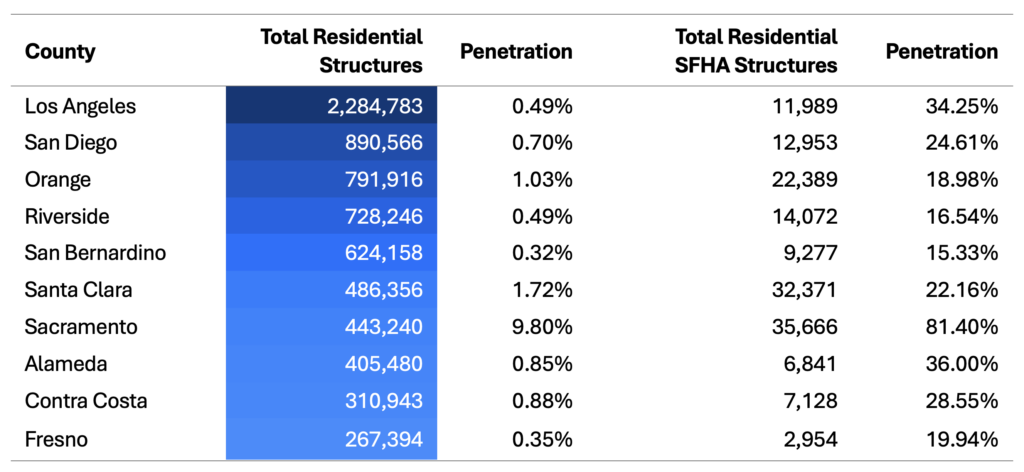
This pattern holds when focusing on California’s most populated counties. While Sacramento County stands out as a notable outlier, overall underinsurance remains consistent across large metropolitan areas, defined here as counties with more than 260,000 residential structures).
Table 2. Flood Insurance Residential Penetration Across California’s Most Populous Counties
Source: OpenFEMA Dataset – NFIP Residential Penetration Rates
Awareness Gaps
In California, approximately 34% of NFIP contracts in force are located outside FEMA-designated high-risk flood zones, where flood insurance is not required. This share is materially lower than in other flood-prone states, such as Texas (66%) and Louisiana (50%), where voluntary flood insurance uptake outside mapped floodplains is more common.
Since 1978, however, almost 45% of NFIP claims in California have occurred outside high-risk flood zones, reinforcing that flood losses frequently occur where insurance coverage is least expected and often not required. Together, these patterns suggest that flood risk in California remains under-recognized relative to peer states, despite modern flood models and historical claims data showing substantial exposure beyond mapped floodplains.
Rising Costs of Flood Insurance
As participation has fallen, average NFIP premiums in California have increased by more than 33% since 2016. A key driver of higher flood insurance costs has been FEMA’s implementation of Risk Rating 2.0, which modernized NFIP pricing to better reflect property-level flood risk. While Risk Rating 2.0 improves risk alignment and transparency, it has also resulted in meaningful premium increases for many California households.
Affordability Pressures
Rising premiums have intensified affordability challenges across the state. According to analysis by the U.S. Government Accountability Office (GAO), full-risk flood insurance premiums represent a significant share of household income, consuming 5–8% of household incomein some California counties (as shown in Figure 4).
These pressures are magnified in California, where households often face:
- Earthquake insurance premiums, often more expensive than flood premiums.
- Homeowners insurance costs, which have risen sharply in recent years due to wildfires.
- One of the highest costs of living in the country, with a cost of living 42% higher than the national average.
When layered together, flood insurance is often viewed as one more competing expense rather than a core component of household financial protection.
Underinsurance Gaps and Coverage Limits
Underinsurance in California is driven not only by low participation but also by coverage limits that fall well below the true cost of rebuilding. According to U.S. Census Bureau data, the median home value in California is approximately $750,000–$800,000. By contrast, the NFIP caps residential building coverage at $250,000.
As a result, even fully insured NFIP policyholders can face substantial out-of-pocket losses after a flood. In many parts of California, NFIP coverage represents less than half (and in some cases less than one-third) of the cost to rebuild.
Figure 3. NFIP – CIF Decline and Rising Premiums
Figure 4. Full-Risk Premiums as a % of Household Income
Source: OpenFEMA Dataset – FIMA NFIP Redacted Policies
Source: U.S. Government Accountability Office
A Path Forward
Flood risk in California is widespread, persistent, and increasingly misaligned with existing insurance coverage. Exposure continues to expand beyond mapped floodplains, while insurance participation remains low and coverage limits often fall well short of the true cost of rebuilding, creating one of the largest coverage gaps in the country.
Closing this gap will require coordinated progress across several fronts:
Invest in Flood Infrastructure
Much of California’s flood-control, levee, and stormwater infrastructure was built decades ago and designed for historical conditions. Targeted investment is needed in riverine systems, urban drainage, and coastal protection, particularly in the Central Valley and major metropolitan areas where exposure is concentrated.
Modernize Flood Risk Mapping
Flood risk increasingly extends beyond FEMA-designated floodplains. Forward-looking, data-driven flood models are available and should be used to better reflect rainfall-driven flooding, urbanization, and changing climate conditions, improving planning, risk communication, and insurance alignment statewide.
Expanding Access to Private Flood Insurance
The NFIP alone cannot close the protection gap. Broader access to private flood insurance can help address affordability and coverage limitations by offering higher limits, replacement-cost protection, often at more affordable prices.
Improve Awareness and Build for Resilience
California’s housing stock reflects a long-standing focus on seismic resilience, while flood resilience has received less attention. Encouraging flood-resilient design, elevating critical living spaces, and integrating flood risk into development decisions can reduce long-term losses and improve recovery outcomes.
As flood losses compound over time and climate change increases the frequency and severity of events, insurance and risk management approaches that align with modern flood risk and real replacement costs will be essential to strengthening financial resilience across the Golden State.
Sources
- [1] NOAA – The Great Flood of 1862
- [2] OpenFEMA Dataset – FIMA NFIP Redacted Claims
- [3] NOAA/NWS – California Nevada River Forecast Center 1986
- [4] NOAA National Climatic Data Center – January & March 1995
- [5] NOAA National Climatic Data Center – California Flooding 1998
- [6] USGS – California Winter Storms 2005-2006
- [7] Stanford Report – Clusters of Atmospheric Rivers 2024
- [8] NOAA – What Are Atmospheric Rivers?
- [9] OEHHA – Indicators of Climate Change in California
- [10] California Department of Finance – Urban Area Delineations
- [11] U.S. Environmental Protection Agency – Stormwater Runoff
- [12] California Legislative Analyst Office – Housing Affordability Tracker
- [13] FEMA – Flood Risks Increase After Fire
- [14] First Street Foundation – The First National Flood Risk Assessment
- [15] OpenFEMA Dataset – FIMA NFIP Redacted Policies
- [16] U.S. Government Accountability Office
- [17] World Population Review – Cost of Living Index, 2026
- [18] U.S. Census Bureau Data – California
