
Deep Dive into FEMA Flood Maps: Gaps, Consequences, and the Role of Innovation
12 min read · Dec 16, 2025
Executive Summary
FEMA’s flood maps have long been the foundation of how Americans understand and manage flood risk. They shape where communities build, how they insure, and how they prepare. Yet, outdated methodologies and persistent gaps have left millions of homeowners vulnerable, exposing them to significant risks that maps fail to capture.
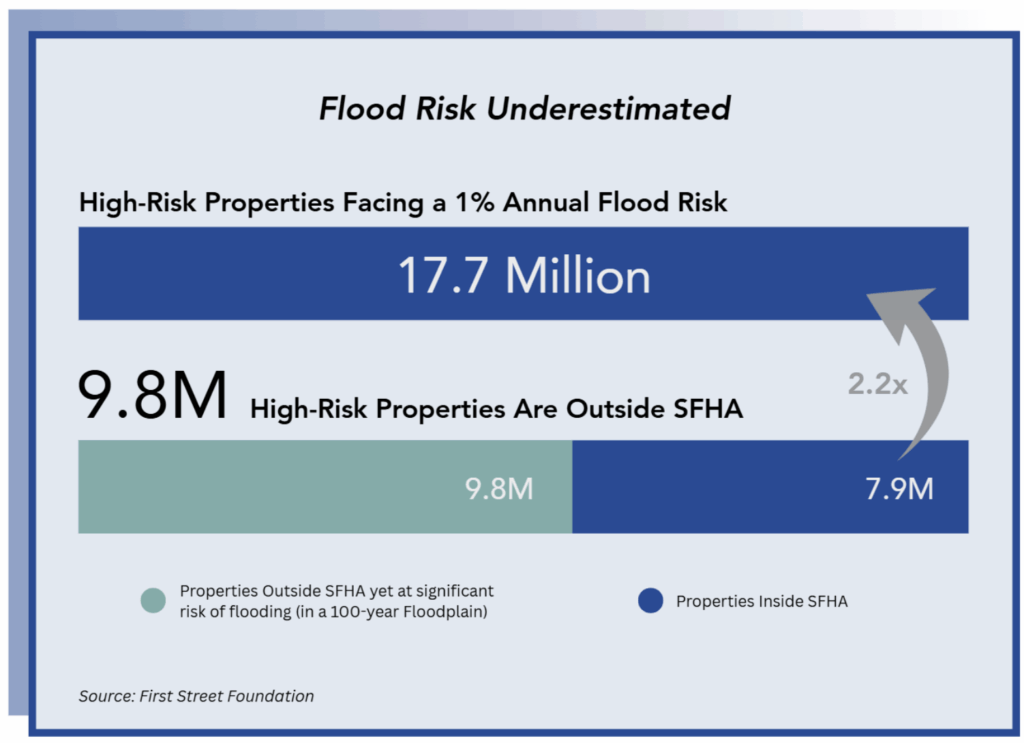
Official maps identify 7.9 million properties as high-risk, but research from the First Street Foundation (as of July 2025) shows the real number is more than double (17.7 million). That means nearly 10 million high‑risk properties fall outside official maps, bypassing critical insurance and building requirements. In addition, millions of properties inside FEMA-mapped high-risk zones remain uninsured. Altogether, 13 million high‑risk properties have no or low flood insurance.
Key Findings
Outdated and incomplete maps leave millions of properties exposed. They fuel underinsurance, distort mortgage markets and property values, and allow risky development to slip through. Between 2019 and 2023 alone, more than 211,000 new homes were built in high-risk areas not identified as such by FEMA, areas treated as “safe” and exempt from flood insurance mandates and stricter building standards.
The Path Forward
- FEMA’s role: Maps should serve as a transparent public good that raises awareness and guides planning. FEMA should leverage advanced commercial stochastic models to provide more accurate risk information and deliver significant cost savings over today’s slow, resource-intensive processes.
- Modernize and expand maps to all populated and growing areas, update them more frequently, and adopt high-resolution data and advanced technology. Incorporate rainfall, flash flooding, the impacts of sea-level rise, and sea temperature increases to capture the full spectrum of flood risk.
- Embrace private innovation: Tech-driven platforms like Neptune’s can deliver faster, property-level risk assessments and more innovative underwriting. These tools can close the coverage gap, expand protection for millions of at-risk homes, and build national awareness where FEMA’s maps fall short.
Introduction
Flood risk assessment in the United States remains a pressing challenge as climate change, rapid development, and aging infrastructure reshape the nation’s hazard landscape. Floods are the country’s costliest and most widespread natural disaster, yet millions of vulnerable properties remain unmapped or inaccurately mapped, and therefore, likely uninsured and unprepared.
For over half a century, the National Flood Insurance Program (NFIP) has relied on Flood Insurance Rate Maps (FIRMs) to define high-risk flood zones, which guide insurance requirements. While these maps serve an important regulatory role, they provide only a partial picture of true flood vulnerability, reducing risk to a simple “inside or outside the high-risk zone” classification. The reality of flood risk is more complex, constantly evolving, and often extends far beyond the official boundaries shown on flood maps.
This report examines the widening gap between mapped and actual flood risk, its causes, consequences, and the urgent need for innovation. Recognizing the limitations of current mapping practices is essential for stakeholders to work toward better assessing and managing flood risk.
History of Flood Insurance Rate Maps and Special Flood Hazard Areas
Flood mapping in the United States began as a response to severe and costly floods, after decades of inconsistent, localized risk management. Many communities either relied on outdated floodplain surveys or had no maps at all, leaving homeowners with little to no understanding of their actual flood risk.
Significant flood events, such as the Mississippi River floods of 1927, which displaced over 700,000 people and caused damages equal to one-third of the federal budget at the time, and Hurricane Betsy in 1965, which caused an estimated $15 billion (adjusted for inflation) in damages, highlighted the urgent need for a unified approach to flood risk.
In response, Congress passed the National Flood Insurance Act of 1968, establishing the National Flood Insurance Program (NFIP) to provide a federal framework for managing flood risk. The program had two core goals: to make flood insurance widely available and to reduce the nation’s flood risk through stronger floodplain management standards.
To achieve these goals, FEMA introduced Flood Insurance Rate Maps (FIRMs), a standardized tool to identify flood risk zones across the country. These maps are based on Flood Insurance Studies (FISs) and identify areas known as Special Flood Hazard Areas (SFHAs), defined as areas with a 1% annual chance of flooding (the “100-year floodplain”).
FIRMs quickly became the backbone of flood risk management:
- Properties inside SFHAs with federally backed mortgages are required to carry flood insurance (about 80% of all U.S. residential mortgages are federally backed).
- Properties outside SFHAs are less likely to carry flood insurance, either because coverage is not mandated or because the perceived flood risk is lower.
From their creation, FIRMs and SFHAs have shaped how the nation understands, regulates, and insures against flood risk. FIRMs are used by:

FEMA Map Modernization and Ongoing Issues
FEMA began modernizing the nation’s flood maps in the 1980s and 1990s, gradually shifting from hand-drawn paper maps to digital versions (DFIRMs). In 2003, FEMA launched the Map Modernization Program to digitize maps nationwide, followed in 2009 by Risk Mapping, Assessment, and Planning (Risk MAP), which aimed to improve technical accuracy and public awareness.
In 2012, Congress passed the Biggert-Waters Flood Insurance Reform Act, which significantly shifted FEMA’s mandate by requiring more accurate and forward-looking data in flood maps. The law instructed FEMA to update FIRMs using the best available science, including information on sea level rise and heavier precipitation. The law also established the Technical Mapping Advisory Council (TMAC), a panel of experts recommending improvements to FEMA’s mapping.
Despite these initiatives, significant challenges remain. Risk MAP has not been formally updated since 2009, and FEMA’s legal obligation to review the need to update flood maps every five years rarely results in actual updates. The outcome is a national mapping system that is outdated, incomplete, and unable to keep pace with today’s flood risk.
The Current State of FEMA Maps (as of 2025)
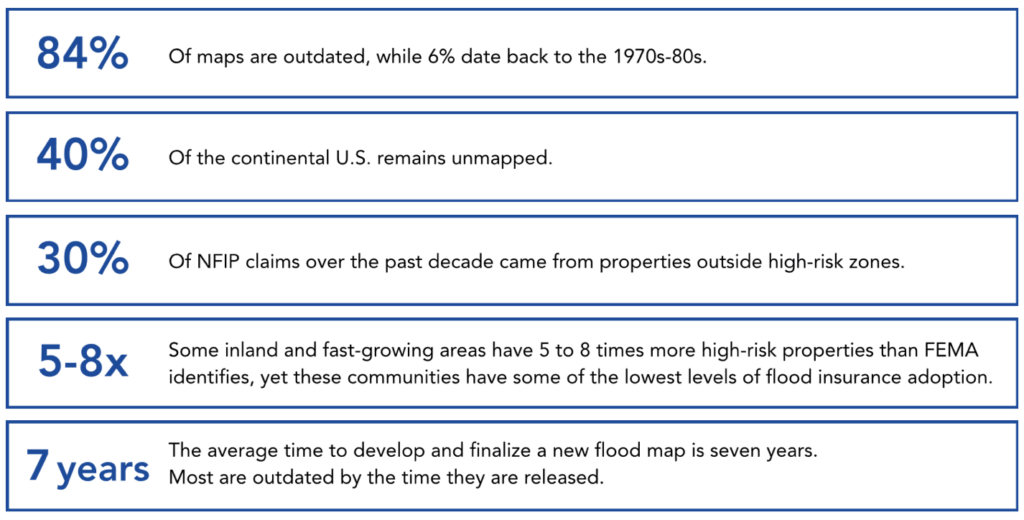
- 84% of maps are outdated (over five years old)
- 6% still date back to the 1970s and 1980s, missing decades of shifts in land use, urban growth, and climate dynamics
- 40% of the continental U.S. remains unmapped
These gaps carry real consequences. Over the past decade (2015-2025), 30% of all NFIP claims came from properties outside FEMA’s designated high-risk zones, proof that millions of properties considered “safe” by official maps are, in reality, highly vulnerable.
Distribution of Outdated FIRMS
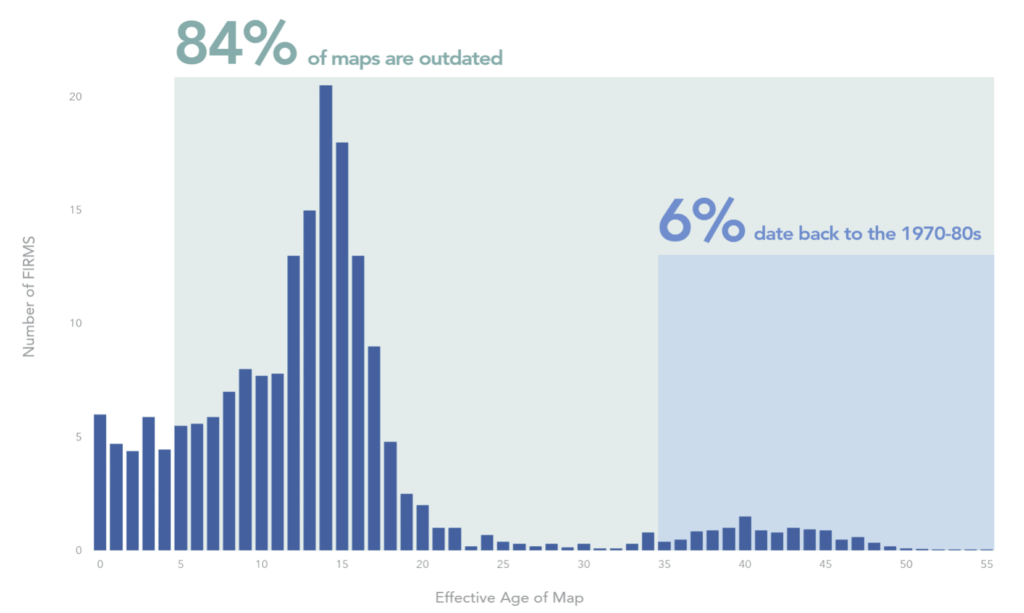
Source: First Street Analysis of FEMA FIRMS
Technical Limitations of FEMA Flood Maps
Despite their central role in understanding flood risk, FEMA’s maps suffer significant technical shortcomings.
Outdated Data and Methods
FEMA’s maps rely heavily on decades-old data, historical flood records, and inconsistent use of modern technology, leaving them far behind today’s evolving realities.
- Climate change is accelerating flood intensity and frequency. Rising sea levels, increased atmospheric moisture, and heavier precipitation have altered historical baselines, yet less than 1 percent of mapped miles account for future climate conditions. Hurricane Helene, for instance, brought unprecedented storm surge levels of 7.2 feet above tide level to Pinellas County, almost double the previous record of Hurricane Idalia.
- Urban development has replaced natural drainage with impervious surfaces like pavement and rooftops. Between 1992 and 2010, Houston lost nearly 25,000 acres of wetlands, reducing natural floodwater absorption by 4 billion gallons. FEMA’s models overlook this risk in fast-growing metro areas where natural floodplains have been replaced with infrastructure.
- Technology gaps persist. Fewer than half of the mapped miles use high-resolution LiDAR (Light Detection and Ranging) data, which allows elevation modeling within inches of precision. Geographic Information Systems (GIS) and fine-scale digital models can integrate rainfall, land use, and surface changes, but adoption is inconsistent and often depends on local funding.
Oversimplified Modeling
FEMA’s hydrologic and hydraulic models often fail to capture real-world complexity.
- Stationary assumptions treat rainfall and river flows as constant, despite clear evidence of more frequent, intense, and longer duration storms.
- FEMA models rarely capture compound flood events, where storm surge and heavy inland rainfall strike simultaneously.
Excluded Risks
FEMA maps focus mainly on coastal surge and river flooding, while other major hazards are largely ignored.
- Pluvial flooding (rainfall) is a growing threat in urban and hilly regions, yet it is rarely mapped. The 2025 flash floods in Kerr County, Texas, devastated neighborhoods far outside FEMA-mapped zones, where only 2.2% of residents had flood insurance.
- Residual risk: Areas “protected” by levees, dams, or floodwalls can still fail, yet the residual risk from these defenses is generally not identified by FEMA maps (even though the Biggert-Waters Act requires them).
Binary Flood Zones
The SFHA framework reduces flood risk into two categories: “in” or “out” of the high-risk zone. This oversimplification creates a false sense of security, leaving many homeowners outside SFHAs to believe insurance or mitigation is unnecessary, even though flood risk exists on a continuum.
- Properties outside SFHA boundaries can face nearly identical flood probabilities as those inside. During Tropical Storm Debby (August 2024), 78% of the flooded properties (representing $10 billion in damages) were outside FEMA’s designated high-risk areas, underscoring how binary maps can mask real exposure.
Political and Institutional Challenges
Even when better science and tools exist, institutional roadblocks often keep FEMA’s maps outdated.
FEMA’s Mapping Approach
The original system made sense in the 1970s, but today’s technology and NFIP’s funding needs demand a new approach. Between 2014 and 2020, FEMA spent $2.3 billion on flood mapping (about $414 million annually in 2019–2020), yet many maps were already outdated upon release.
By contrast, advanced stochastic flood models are commercially available that can deliver faster, more accurate property-level assessments at a fraction of the cost. Incorporating these tools would reduce reliance on slow, resource-intensive cycles, empower homeowners with up-to-date risk information, and lower federal spending.
Bureaucratic and Administrative Delays
Updating maps requires coordination across federal, state, and local levels, with long review and appeal periods.
- On average, it takes 7 years to develop and finalize a new map, mainly due to the lengthy due process of public review and acceptance period. As a result, many are often obsolete by the time they are released.
Political and Public Resistance
Map updates often face pushback because new designations bring significant financial and regulatory consequences. Local officials, property owners, and developers frequently challenge FEMA’s maps through appeals that can delay or even overturn high-risk classifications for years.
- Homes newly mapped into SFHAs with federally backed mortgages would now be mandated to have flood insurance.
- Updated maps often impose stricter elevation and construction requirements.
Between October 2024 and August 2025, FEMA approved 6,700 appeals (86%) to remove properties from high-risk zones and 2,900 elevation-by-fill requests (93%) (a process where developers raise the ground level of a property with soil or other material to lift it above the base flood elevation and have it reclassified as outside the flood zone), a strikingly high success rate that underscores how communities can reshape official flood boundaries.
Local leaders may resist or delay high-risk designations, thereby avoiding insurance mandates and building code requirements, which limits the adoption of more accurate risk zones while exposure continues to grow. For example, New York City’s 2015 appeal of a proposed FEMA map, which would add roughly 35,500 properties to high-risk zones, remains unresolved a decade later. As a result, the city still relies on maps that are more than 20 years old. Similarly, Key West, Florida, is appealing a 2019 proposal that would place about 2,000 properties into high-risk zones.
In effect, FEMA’s mapping process has become as much a political negotiation as a scientific exercise. Communities may gain short-term financial relief by resisting or delaying high-risk designations, but the consequence is long-term vulnerability and underinsurance, a trade-off increasingly exposed by recent floods across the country.
Coverage Gaps and Risk Underestimation
FEMA’s maps consistently underestimate the scale of flood risk, leaving millions of households uninsured, communities misinformed, and local economies exposed.
Millions of High-Risk Properties Unprotected
Independent analysis by First Street Foundation revealed that 17.7 million properties face at least a 1% annual chance of flooding, more than double FEMA’s estimate of 7.9 million.
Of these 17.7 million high-risk properties:
- 10 million lie outside FEMA’s mapped SFHAs, where insurance is not required and awareness is low.
- Nearly 13 million high-risk homes remain uninsured or underinsured.
FEMA is responsible for mapping more than 3.5 million miles of rivers and nearly 95,000 miles of coastline, yet a Government Accountability Office (as of October 2021) assessment found that 1.3 million miles of rivers and streams remain unmapped. As a result, flood risk is significantly underestimated in thousands of growing and already-developed communities across the country.
Urbanization Outpacing Maps
Ongoing development is exploiting the gaps in FEMA’s outdated maps. Between 2019 and 2023, tens of thousands of new homes were built in high-risk areas not identified as SFHAs by FEMA. According to the First Street Foundation:
- Florida added 77,000 properties in high-risk areas. Over half of those were built outside SFHA boundaries, bypassing critical insurance and building code requirements.
- Texas added 63,000
- California added 21,000
- North Carolina added 11,000
Geographical Disparities in Mapping
FEMA maps disproportionately focus on riverine and coastal flooding, often overlooking inland hazards.
- In many rural and inland counties, 5 to 8 times more properties are at significant flood risk than FEMA maps identify. Wealthier coastal counties and populous regions are more likely to receive map updates, while inland and lower-income areas can go decades without updates.
- Under Risk Rating 2.0 (introduced by FEMA in 2021 to replace subsidized pricing with actuarially accurate rates), the shortcomings of outdated maps have become more apparent. Communities where maps understated actual exposure are now facing some of the steepest premium hikes, as rates align more closely with real risk, intensifying affordability concerns.
Difference in Number of Properties at Substantial Flood Risk Compared to FEMA
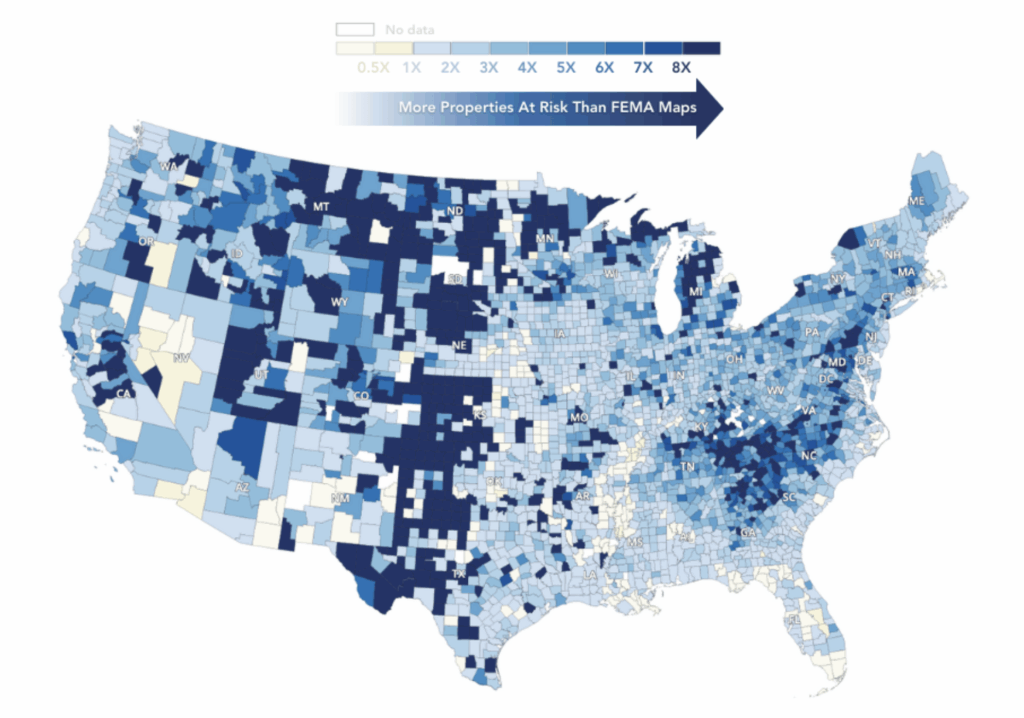
Source: First Street Analysis of FEMA FIRMS
Implications of Mapping Discrepancies
FEMA’s mapping gaps ripple across the housing and financial system, distorting insurance, lending, development, and community resilience decisions.
Widespread Underinsurance and Unequal Awareness
Millions of high-risk properties remain outside mandatory insurance zones, leaving homeowners unaware of their true exposure and widening the protection gap. Hurricane Helene (September 2024) underscored this near Asheville, NC, where only 0.7% of homeowners in Buncombe County carried NFIP policies, leaving the vast majority exposed when flash floods struck. This reflects the broader lack of awareness and protection nationwide in many rural and inland regions.
Distorted Markets and Lending Risk
When a property lies outside an SFHA, flood risk is understated.
- Homeowners often assume “outside the zone” means safe and forgo insurance or mitigation.
- Banks and mortgage lenders underprice risk in loan underwriting, raising default risk when uninsured flood losses occur.
- Real estate markets misvalue properties by inflating prices in flood-prone areas outside SFHAs, masking the true cost of ownership.
Misguided Planning and Development
Cities and states often allocate resilience dollars and infrastructure upgrades based on FEMA maps, leaving nearby high-risk areas unprotected. At the same time, development patterns exploit mapping gaps: between 2019 and 2023, more than 211,000 new homes were built just outside mapped zones, bypassing elevation and insurance requirements while placing homeowners in flood-prone areas.
Strain on the NFIP
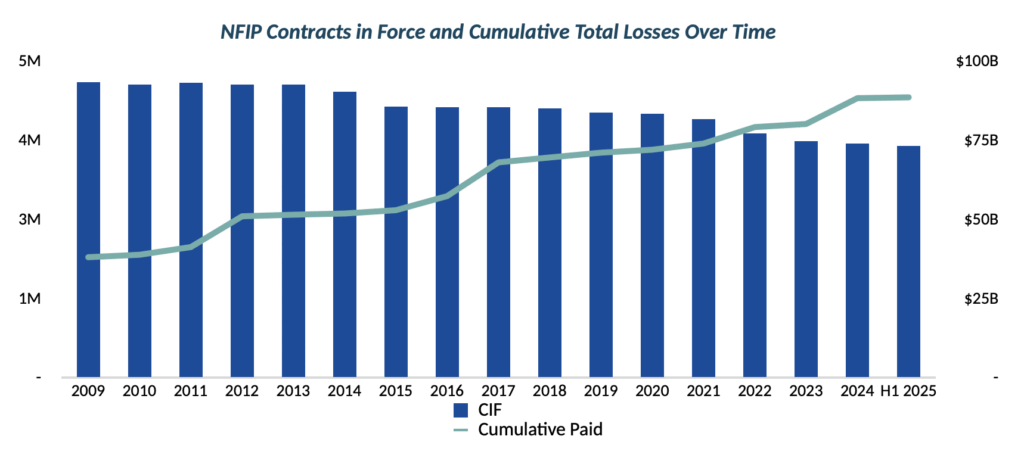
Despite mounting flood losses, the number of NFIP-insured properties has fallen from 4.7 million in 2009 to 3.66 million in 2025. This growing coverage gap poses a threat to the nation’s housing market, underscoring the need for improved risk assessment tools and private-sector innovation.
The Path Forward
Fixing America’s outdated flood mapping system requires more than incremental updates. It demands a shift from static, binary zones to dynamic, property-level models that capture the full continuum of flood risk and incorporate overlooked hazards like rainfall, flash flooding, climate change, and urban growth.
FEMA’s Role
Flood mapping should serve as a transparent and accessible public good, raising awareness and guiding community planning. FEMA must ensure that its five-year review requirement results in actual updates, adopt high-resolution data as the standard, and make maps fully accessible.
Private Innovation
Private players like Neptune can bridge the gap. Using cutting-edge data and AI-driven technology, they provide property-level risk insights that enable smarter underwriting, fairer pricing, and expanded coverage for the millions of homes FEMA’s maps miss. Private innovation can, therefore, supplement public mapping and close the protection gap more effectively than government processes alone.
Lenders’ Role
Lenders remain a critical line of defense in ensuring that high-risk homes are insured, yet they also carry enormous exposure to flood risk through their mortgage portfolios. Today’s underinsurance, driven by outdated maps, inadequate coverage limits, and limited recognition of private market solutions, requires a rethinking: banks and financial institutions must modernize how they measure flood risk in their portfolios. By doing so, lenders can better protect their balance sheets, reduce systemic financial risk, and strengthen resilience across the housing market.
Conclusion
Public agencies, private innovators, and financial institutions all have a role to play. By combining transparent mapping, advanced property-level modeling, and stronger private market participation, the U.S. can close its growing protection gap and build climate resilience from the ground up.
